
SST Operations Bridge Web Client Guide, Version 1.1

SST/OB Web Client Application 29
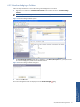
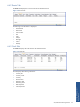
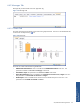
4-4-9 Messages Tab
Messages tab provides SSTOB web server application log.
Figure 4-19 Messages Tab
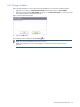
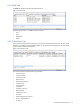
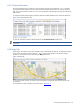
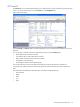
4-4-10 Charts Tab
The Charts tab represents the tabular numeric data in the graphical format. The Views in the Dashboards that
contain charts are depicted using icon.
Figure 4-20 Charts Tab
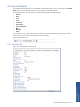
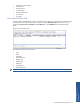
The charts are visible under the following Dashboards:
• BASE24 Network Dashboards: Chart is available for the BASE24 Network Chart Local View. The
parameters available include Count and Category of Terminals.
• Overall Status Graph: The parameters include Count and Status of Terminals.
• Region Based Monitoring: Chart is available for the Terminals Out of Service Count / Region Local view.
The parameters include Terminals out of Service and Region.
• XPNET Graphs: Chart is available for the Terminals Count Vs XPNET Entity Down Local View. The
parameters include Number of Terminals and Cause.
SST/OB Web Client
Application