
SST Operations Bridge Web Client Guide, Version 1.1


SST Reports: Overview 42
5-4 View Reports
5-4-1 Introduction
SST Operations Bridge provides reports that allow you to evaluate your terminal environment status and
performance, hence keeping the entire terminal network running at a maximum efficiency. The user can also
view the reports as per their needs. For example, a user can view the detailed availability status of all the
terminals by generating the report for the specified time interval.
5-4-2 Reports Generation
Follow the steps given below to generate the reports:
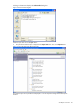
1. Click on the Show Reports link available under the Reports tab of SST/OB Web Client. This displays the
Reports area on the right side of the window.
2. The Reports area enables you to select the report to be viewed. Click on the selected report.
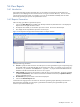
3. This displays the list of parameters required to view the report.
Figure 5-6 SST Operations Bridge Web Client Parameters For Reports Window
Specify the following parameters:
From/To: Specify the date interval for which the reports are to be generated using the corresponding drop-
down fields. Make sure that both the fields do not have the same values. For example, if you want to see
the data of 1
st
July 2009 then select From/To as 1
st
July’2009 – 2
nd
July’09 then the data fetched from the
database would be from 00:00:00 till 23:59:59. Of 1st july’09
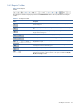
Select Terminals: Specify the list of terminals for which the report is to be generated. The options available
are From a Terminal Set (to select a Terminal set from the available terminal sets) and Specific Terminal (to
select an individual terminal).
No of Records: Specify the number of records to be displayed.
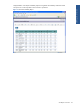
4. Click on the Generate Report button.
It could take time ranging from few seconds to few minutes for generating report depending on the amount of
data and duration requested. Once the report is generated the Parameters panel gets folded to provide
maximum space to the rendered report.