
SWAN Concentrator and WAN Subsystem Troubleshooting Guide


Troubleshooting the SWAN Concentrator and WAN
Subsystem
SWAN Concentrator and WAN Subsystem Troubleshooting Guide—426992-008
1-4
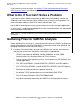
Tracing a Communications Line
Tracing a Communications Line
To start tracing a communications line, use the SCF TRACE command. Tracing
enables you to see the history of a communications line, including significant points in
the internal processing of the traced entity.
For tracing to be an effective, fault-finding tool, follow these guidelines:
•
Always trace both ends of a communications path.
•
Ensure that all traces for a particular problem are taken at the same time.
•
If the data rate is high or if the trace is expected to run for many hours, preallocate
the file space for the trace file by using the File Utility Program (FUP). A
3-megabyte or 4-megabyte file is generally enough for all but the longest or most
work-intensive traces.
•
For Expand lines, gather a $NCP trace even if you do not think the problem
involves $NCP. It is preferable to have too much rather than too little information.
You can display trace files by using the commands available in the PTrace program.
For information about PTrace, see the PTrace Reference Manual. For information
about the SCF TRACE command and the communications subsystem you want to
trace, see the Configuration and Management Manual.
Finding SWAN Concentrator and WAN
Subsystem Event Messages in the Event Log
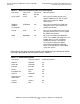
Before you search the event log ($ZLOG) for SWAN concentrator and WAN subsystem
event messages, you should be familiar with the names of the processes and objects
that support the SWAN and SWAN 2 concentrators and WAN subsystem devices
(DEVICE object). For information about how to identify these processes and objects,
see Identifying the WAN Subsystem Processes and Objects on page 3-6.
Look for messages generated by the subsystems listed in Table 1-1.