
TCP/IP Configuration and Management Manual

SCF Reference
TCP/IP Configuration and Management Manual—427132-004
4-111
NonStop TCP/IP Trace Facility
Examples
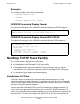
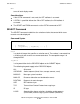
The second example shows the null command.
->VERSION PROCESS $ZTC0
->VERSION
->VERSION PROCESS $ZTC0, DETAIL
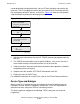
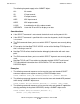
VERSION Command Display Format
The format of the display of the VERSION command without the DETAIL option is:
VERSION Command Display Format With DETAIL
The format of the display of the VERSION command with the DETAIL option is:
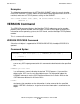
NonStop TCP/IP Trace Facility
This section contains the following information:
An introduction to the NonStop TCP/IP trace facility
A description of the subsystem-specific PTrace commands and any special
considerations for using these commands with the NonStop TCP/IP subsystem
An example of each type of trace record display
Introduction to PTrace
Trace files contain a record of the communications between processes. Each
subsystem determines what information is recorded in its trace files. This information
varies as to the type of events that are recorded, the amount of detail that is included,
and other subsystem-specific attributes.
You can generate a NonStop TCP/IP trace file interactively or programmatically. To
start a trace and capture data interactively, you use the SCF TRACE command. To
start a trace and capture data programmatically, you use the Subsystem Programmatic
Interface (SPI). The trace files created with either SCF or SPI are unstructured and
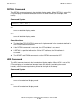
SCF> VERSION PROCESS $ZTC0
VERSION PROCESS \SYSA.$ZTC0: T9551D41^29FEB96^TCPIP^D41002^00
SCF> VERSION $ZTC0, DETAIL
Detailed VERSION PROCESS \SYSA.$ZTC0
SYSTEM \SYSA
T9551D41^29FEB96^TCPIP^D41002^00
GUARDIAN - T9050 - (P40)
SCF KERNEL - T9082F40 - (29FEB96) (01JAN96)
TCPIP PM - T6243D41 - (29FEB96) - (03SEP96)