
TCP/IP Configuration and Management Manual

SCF Reference
TCP/IP Configuration and Management Manual—427132-004
4-112
Introduction to PTrace
cannot be printed or displayed directly. You use PTrace to display and examine the
trace files. The PTrace program formats the data stored in these unstructured trace
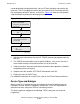
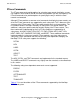
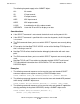
files for output to terminals, printers, or disk files. Figure 4-2 shows the four general
steps involved in recording and formatting trace data.
1. Start the trace interactively with the SCF TRACE command or programmatically
with SPI.
2. The TRACE command allows you to specify attributes, such as the size of the
trace records and the name and maximum size of the trace file.
3. Collect trace data. Send and receive data or perform other operations related to
the problem you are analyzing.
4. Stop the trace with another SCF TRACE command or with SPI.
5. Display the trace file with PTrace.
For additional information on using PTrace, refer to the PTrace Reference Manual.
Device Type and Subtype
When a trace file is created, the type and subtype of the device being traced are
recorded in that file. When PTrace opens the trace file, it uses this information to
determine for which subsystem PTrace is formatting records.
The device type and subtype for the NonStop TCP/IP subsystem are 48 and 0,
respectively.
Figure 4-2. Recording and Displaying Trace Data
014VST .VSD
Start the trace interactively
with the SCF TRACE
command or programmatically
through SPI.
Collect trace
data.
Display the trace
file
with PTrace.
Stop the trace with the
SCF TRACE command or
through SPI.