
TCP/IPv6 Configuration and Management Manual (G06.29+, H06.03+, J06.03+)

SCF Reference for NonStop TCP/IPv6
HP NonStop TCP/IPv6 Configuration and Management Manual—524523-012
8-213
Introduction to PTrace
A description of the subsystem-specific PTrace commands and any special
considerations for using these commands with the NonStop TCP/IPv6
An example of each type of trace record display
Introduction to PTrace
Trace files contain a record of the communications between processes. Each
subsystem determines what information is recorded in its trace files. This information
varies as to the type of events that are recorded, the amount of detail that is included,
and other subsystem-specific attributes.
You can generate a NonStop TCP/IPv6 trace file interactively or programmatically. To
start a trace and capture data interactively, you use the SCF TRACE command. To
start a trace and capture data programmatically, you use the Subsystem Programmatic
Interface (SPI). The trace files created with either SCF or SPI are unstructured and
cannot be printed or displayed directly. You use PTrace to display and examine the
trace files. The PTrace program formats the data stored in these unstructured trace
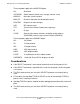
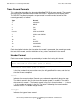
files for output to terminals, printers, or disk files. Figure 8-3 shows the four general
steps involved in recording and formatting trace data.
1. Start the trace interactively with the SCF TRACE command or programmatically
with SPI. The TRACE command lets you specify attributes, such as the size of the
trace records and the name and maximum size of the trace file.
2. Collect trace data. Send and receive data or perform other operations related to
the problem you are analyzing.
3. Stop the trace with another SCF TRACE command or with SPI.
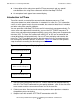
Figure 8-3. Recording and Displaying Trace Data
Start the trace interactively by using
SCF or programmatically through SPI.
Collect the trace data.
Stop the trace by using the SCF
TRACE command or through SPI.
Display the trace file with PTrace.
VST014.vsd