
TS/MP System Management Manual (G06.24+, H06.03+)


Tuning Your System by Using Statistics
NonStop TS/MP System Management Manual—541819-001
7-6
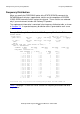
Response Time Info
the moment after it issues a SEND statement and stopping the clock the moment after
it receives a reply from the server process. The captured measurements represent
server response time.
Example 7-4
shows only the RESPONSE TIME INFO section of the sample server
statistics. See this example as you read this section.
Table 7-3
shows the response time statistics and what they indicate.
If the number for STAND DEV is large in comparison to the number for AVG RESP,
you should review your application to determine the cause.
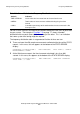
These are the limits imposed on measurement collection:
•
Measurements will stop for any server upon the 99,999,999th measurement.
•
Any measurement greater than 99,999,999.99 seconds is discarded.
•
Once a measurement counter reaches 99,999,999.99 seconds, measurements will
stop being collected for this server.
•
Response times are rounded to the nearest hundredth of a second.
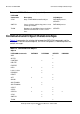
Example 7-4. RESPONSE TIME INFO Section of Sample Server Statistics
SERVER SERVME?
IN TCP TCP1* 19 FEB 1996, 15:22:30
.
.
.
RESPONSE TIME INFO (TIME VALUES IN SECS)*:
SEND TO SERVERCLASS
SUMMARY # MEAS AVG RESP MAX RESP MIN RESP STAND DEV
33303 0.50 2.51 0.10 0.49
.
.
.
*Collected only if you have the Pathway/iTS product and TCP STATS ON
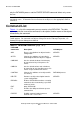
Table 7-3. Server Statistics for Response Time
Statistic Indicates
# MEAS Total number of collected measurements
AVG RESP Average response time calculated from the collected measurements
MAX RESP Maximum response time recorded during the given time interval (since
statistics were turned on or reset)
MIN RESP Minimum response time recorded during the given time interval (since
statistics were turned on or reset)
STAND DEV Standard deviation calculated from the collected measurements