
TS/MP System Management Manual (G06.24+, H06.03+)


Tuning Your System by Using Statistics
NonStop TS/MP System Management Manual—541819-001
7-7
Frequency Distribution
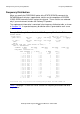
Frequency Distribution
When you specify the FREQTABLE option of the STATS SERVER command, the
PATHMON process displays supplemental statistics on the completion of SCREEN
COBOL SEND statements within a given time interval. These statistics are collected
only if your environment includes the Pathway/iTS product.
The supplemental information is contained in the frequency distribution table, as shown
in Example 7-5. A separate frequency distribution table is generated for each server
class.
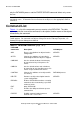
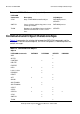
Table 7-4 on page 7-8 shows the server statistics for frequency distribution and what
they indicate.
Example 7-5. Sample Server Statistics With Frequency Distribution Table
SERVER SERVME
IN TCP TCP1* 19 FEB 1996, 15:26:14
QUEUE INFO*: REQ CNT % WAIT MAX WAITS AVG WAITS % DYNAMIC
33710 99.8 7 2.38 99.9
I/O INFO*: REQ CNT MAX TSIZE AVG TSIZE I/O CNT
SEND 33740 2 2 33740
REPLY 2 2
RESPONSE TIME INFO (TIME VALUES IN SECS)*:
SEND TO SERVERCLASS
SUMMARY # MEAS AVG RESP MAX RESP MIN RESP STAND DEV
33739 0.50 2.51 0.01 0.49
FREQUENCY DISTRIBUTION*:
TIME INTERVAL (0.05 SECS) # MEAS CUM %
TI01 < 0.01 132 0.3
0.01 <= TI02 < 0.05 16720 49.9
0.05 <= TI03 < 0.11 5 49.9
0.11 <= TI04 < 0.17 1 49.9
0.17 <= TI05 < 0.22 9 49.9
0.22 <= TI06 < 0.28 0 49.9
0.28 <= TI07 < 0.34 0 49.9
0.34 <= TI08 < 0.39 1 49.9
0.39 <= TI09 < 0.45 1 49.9
0.45 <= TI10 < 0.51 0 49.9
0.51 <= TI11 < 0.56 0 49.9
0.56 <= TI12 < 0.62 0 49.9
0.62 <= TI13 < 0.68 0 49.9
0.68 <= TI14 < 0.73 0 49.9
0.73 <= TI15 < 0.79 0 49.9
0.79 <= TI16 < 0.85 0 49.9
0.85 <= TI17 < 0.90 0 49.9
0.90 <= TI18 < 0.96 0 49.9
0.96 <= TI19 < 1.02 16472 98.8
1.02 <= TI20 398 100.0
*Collected only if you have the Pathway/iTS product and TCP STATS ON