
TS/MP System Management Manual (G06.24+, H06.03+)


Tuning Your System by Using Statistics
NonStop TS/MP System Management Manual—541819-001
7-8
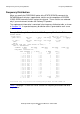
Frequency Distribution
You can use the statistics for frequency distribution to determine the times of peak load
for your system. The example in Example 7-5 on page 7-7 shows a bimodal
distribution with one peak almost 20 times as long as the other. This is an indication
that some system level tuning might be required.
The frequency distribution table is not generated if either of these are true:
•
There are fewer than 50 sample measurements collected at the time of the STATS
request. In this case, this text appears at the bottom of the STATS SERVER
display:
FREQUENCY DISTRIBUTION:? NOT PRODUCED: LESS THAN 50 SAMPLE
MEASUREMENTS TAKEN
•
At the fiftieth measurement, the time increment calculated is less than 0.01
second. In this case, this appears at the bottom of the STATS SERVER display:
FREQUENCY DISTRIBUTION:? NOT PRODUCED: COMPUTED INTERVAL
LESS THAN .01 SECS
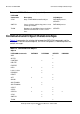
Table 7-4. Server Statistics for Frequency Distribution
Statistic Indicates
TIME INTERVAL Value of the time increment from one interval to the next
# MEAS Total number of measurements collected during the given time
interval
CUM % Cumulative percentage of the total number of measurements the line
item represents