
ViewSys User's Guide

ViewSys User’s Guide—526358-002
5-1
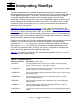
5 Interpreting ViewSys
There are no absolute rules to follow for performance tuning HP NonStop systems.
Recommended rates for various system resources vary from system to system, based
on the application being run. These rates all interrelate to determine the number of
transactions performed per second and the average response time for those
transactions. Experience with the system and the applications being run allows you to
detect imbalances and inefficiencies within that system. The ability to view a single
resource use over all the processors in a system you to balance the disposition of
processes across the system.
Appendix B, ViewSys Measurement Entities, lists the formulae that determine the
percentages used, which are then displayed on bar graphs. Section 6, Measurement
Techniques, explains what constitutes 100% of a resource. Generally, if a resource
display approaches 80% used, you should monitor that resource. It is common to see
poll periods where this threshold is reached or exceeded, but a continuous reading at
that level indicates potential system degradation.
ViewSys also monitors over time the maximum percentage ever used on the measured
resources. The maximum values are initialized at program start-up and again
whenever the INS LINE function key is pressed. Selecting the Maximum mode by
pressing the ROLL DOWN function key, then displays the highest percentage used
since the last initialization point. ViewSys can run for a set period; for example, two
hours; and display processors that might be underused.
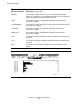
Table 5-1 describes the entities that are measured and reported. Figures 5-1 to 5-15
show each of the ViewSys reports.
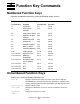
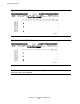
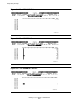
Table 5-1. ViewSys Reports
Measured Entities Description (page1of2)
CPUBUSY The percentage of time a processor is not idle during the polling
period. (Processor busy + interrupt busy time)
CPUQUEUE The average number of processes on the ready list during the polling
period. (Processes that are ready to run)
PAGEFAULT The average number of page faults that occurred, per second, during
the polling period.
MEMQUEUE The average number of processes awaiting page fault servicing
during the polling period.
DISPATCH The average number of process dispatches per second during the
polling period.
SENDBUSY The percentage of time during the polling period that a send was
being performed within a processor.
CACHEHITS The average number of disk cache hits per second during the polling
period.