
Web ViewPoint User Guide, Version 5.14


Web ViewPoint User Guide Version 5.14 - 528226-014 121
5.4 PERFORMANCE
The performance monitor provides an online subsystem that monitors continuously and that enables receiving and
displaying current performance metrics.
5.4.1 OVERVIEW
The performance monitor is divided into four categories
Live: Select and monitor one or more (up to 14) processor performance attributes. Chosen attributes will be
graphed at set intervals. You can display data simultaneously for multiple attributes and processors and select the
order in which they are graphed.
Trend: Follow a trend of usage values for selected attributes and/or processors over time. It displays up to 60
points of time, with a customizable interval
Process: View a customizable list of the current busiest processes on the server - either per processor or per
server. A single click on a process gives access to additional information (for example, detail properties, files
opened, processes spawned) and commands (such as Stop, Suspend, and Activate). This provides a quick online
data mining tool for all processors, processes, and files.
WebDash: This feature provides a dashboard view across multiple nodes to monitor, in real time, any
combination of 5 performance entities in addition to live EMS messages from each of the nodes. This single screen
is a complete window to the real time health of the neighborhood.
[Back to TOC]
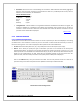
5.4.2 PERFORMANCE LIVE
This feature opens a live monitor to CPU and Process attributes of your hp NonStop Server. Displayed layout and
attributes, as well as the interval at which information is refreshed, is based on your selections at
Section 5.4.2.1.
To get to the Settings Window, click on its icon on the upper right side of the Window.
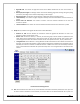
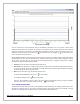
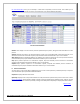
CPU Graph: The CPU graph shows the current metrics (as of the last refresh) for selected attributes and CPUs. This
information is refreshed at your selected time interval. To stop the refresh, click on the icon on the toolbar.
The icon changes to: . You may click on this icon to resume the automatic refresh operation.
The title of the graph shows the NonStop Server for which the information is displayed, as well as the time
(hh:mm:ss) of the last update/refresh, and the selected interval.
CPU Attributes: Value of selected CPU attributes are displayed on the graph in a bar format. This shows the
percentage of current usage of each resource/attribute (e.g. CPU busy) vs. the 100% maximum acceptable value
for your system/processor type. This maximum value is calculated internally by Web ViewPoint and varies for
different processor types. The color yellow is used when the value of an attribute for a CPU is between 80 and 89
percent of its designated maximum, and red when it is at or above 90 percent. Other lower values are displayed
using a different predefined set of colors.
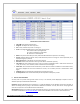
Raw values of the following attributes are shown on mouse over of the bar on the graph:
CPU Queue
Page Fault Rate
Memory Queue
Dispatch Rate
Cache Hit Rate