
Web ViewPoint User Guide, Version 5.14


Web ViewPoint User Guide Version 5.14 - 528226-014 122
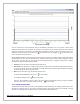
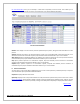
Disk IO Rate
Tuning Window: If selected at
Performance Live Settings Page, a tuning Window is displayed over the graph. This
window appears as a grey-bordered rectangle that runs the width of the graph. This area identifies the acceptable
upper and lower range for CPU busy of all CPUs. For a CPU to be in tune with the rest of the CPUs, its CPU busy
should fall somewhere in this area. A distinct line which runs horizontally at the half point of this area identifies the
optimal CPU busy value. This tuning Window is refreshed at each interval.
Attribute Plot: On the
Performance Live Settings Page, you may choose to plot the value of any of the available 14
CPU attributes. This results in a line plot over the displayed graph, where at each interval a point is added to the
plot line, representing the value of the selected attribute at that point in time. The plot shows values for a
maximum of 60 intervals. After that, older information is discarded as new values come in and are plotted.
CPU Process Menu: The graph’s X axis label for each CPU is also a link to a command menu for that CPU. Click on
any CPU number to access the command menu for that CPU. Following is a list of available commands:
Top 5 – Displays the current (delay of 0 to 15 seconds) list of top 5 busiest (based on CPU busy) processes on
the selected CPU.
Top 10 – Displays the current (delay of 0 to 15 seconds) list of top 10 busiest (based on CPU busy) processes
on the selected CPU.
All – Displays the list of all processes on the selected CPU.
Results from all three commands are displayed in a new Window showing a process table. Additional links and
commands are available from this Window. Refer to
Process Table for more information.
[Back to TOC]
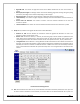
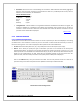
5.4.2.1 PERFORMANCE LIVE SETTINGS PAGE
This Window is used to define the content to be displayed on the Live Graph. The setting you define here is also
recorded in a cookie on your PC. This cookie is read and used the next time you open this or the Live Graph
window. The setting Window is displayed in five separate areas as described below:
A. CPU: Choose to display information for all CPUs, or a selected subset. CPU selections are from 0 to 15. Web
ViewPoint ignores CPU selections that are not present on your Server (e.g. selecting CPU 12 on a 4 CPU
system).
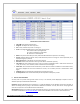
B. Attribute: Choose one or more attributes from 1 to 14 of the available attributes. They are:
CPU Busy: The percentage of time a Processor is not idle during the polling period. (Processor busy +
interrupt busy time.)
CPU Queue:The average number of Processes on the ready list (Processes which are ready to run.)during
the polling period as a percentage of the maximum depending on the CPU type.
Send Busy:The percentage of time during the polling period that a send was being performed within a
Processor.
Dispatch Rate:The average number of Process dispatches, per second, during the polling periodas a
percentage of the maximum depending on the CPU type.
Disc I/O Rate: The average number of disk I/Os, per second, during the polling period as a percentage of
the maximum depending on the CPU type. This will be an accumulation of all disk I/Os for the entire disk
Processes within the Processor being reported.
Cache Hit Rate: The average number of disk cache hits, per second, during the polling period as a
percentage of the maximum depending on the CPU type.
Page Fault Rate: The average number of page faults which occurred, per second, during the polling period
as a percentage of the maximum depending on the CPU type.
Low PIN PCB: The number of Low PIN Process Control Blocks allocated at the time the Processor is polled.