
Web ViewPoint User Guide, Version 5.14


Web ViewPoint User Guide Version 5.14 - 528226-014 124
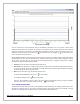
plot line. This plot maintains values for up to 60 intervals. Past this limit, old data will be discarded as new
information arrives and is plotted at each interval.
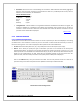
E. Show: This area is designated to settings for process level information. Two available options are:
Process Count: Choose whether the Process count per CPU should be displayed on the CPU Graph. This sets a
second y axis on the graph to keep track of this count. Process count can be displayed in one of two ways:
Summary: A summarized count of all processes is displayed per CPU.
Detail: Process count is displayed in a stacked bar format for the following categories:
a) Primary:Processes that are the primary process of a NonStop pair.
b) Backup: Processes that are the backup process of a NonStop pair.
c) Single: Processes that are
not part of a NonStop pair.
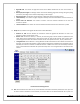
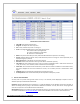
Busy List: Choose to display a table representing the top 5 or 10 busiest (based on CPU busy) processes on the
system. This information is refreshed at a fixed interval of 15 seconds.
As such, it may not always be fully
synchronized with the CPU Graph. The Process Table is displayed below the CPU Graph. Additional links and
commands are available from this Table. Refer to
Process Table for more information.
If needed, you may click on the Reset button to reset all selections to the default settings.
Click on the Submit button once your selections are made. The Live Performance Window will be displayed based
on your defined settings. These settings are also kept in a cookie on your PC, and applied again the next time you
open a Live Performance Window.
[Back to TOC]
5.4.3 TREND
This Window displays historical data for average value of a selected CPU attribute. (NOTE: To enable this option in
the menu bar, set PARAM SHOWENHANCED YES in the WEBVPT5 section of WVPCONF). Information is derived
from a database on the NonStop Server, where aggregations are performed automatically at several different
resolutions. This can be as high as every one minute to as low as monthly averages. Duration for which data is
retained varies for different resolutions. More on this is explained in
Section 5.4.3.1.