
Web ViewPoint User Guide, Version 5.14

Web ViewPoint User Guide Version 5.14 - 528226-014 131
5.4.5 WEBDASH
This feature provides a dashboard view across multiple nodes to monitor, in real time, any combination of 5
performance entities in addition to live EMS messages from each of the nodes. This single screen is a complete
window to the real time health of the neighborhood.
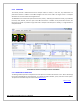
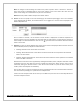
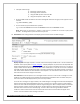
The WebDash screen shows these performance entities, namely – CPU Busy (Live and Active Trend), Top 10 Busiest
Processes, Disks, NetLine, File and a plot of the TMF Transactions. In addition to the performance entities, live
Events are also shown. It provides a single node view or multiple node view (As it is below); in a single window or
multiple windows.
View different entities from multiple residents in WebDash
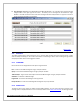
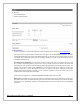
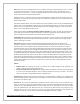
5.4.5.1 WEBDASH SETTINGS PAGE
The Settings window provides a comprehensive set of options to customize the monitor screen. Note: The Settings
for Events from WebDash has two limitations; 1) no display template available, 2) only start with minutes option.
The options are available only from Events Live tab
Section 5.5.2
[Back to TOC]