
Web ViewPoint User Guide, Version 5.14

Web ViewPoint User Guide Version 5.14 - 528226-014 133
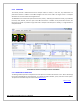
5.4.5.2 WEBDASH MONITOR SCREEN
The WebDash monitor screen displays the performance entities and live events. Depending on the settings
information the presentation is for a single resident or multiple residents. Based on the screen size at the time of
setting the options in WebDash, the panels are aligned within that screen size only. If the screen is then expanded
the panels do not realign themselves according to the changed screen size.
A. CPU Busy
In case of multiple residents: The CPU busy information is shown as a gauge dial. The average CPU busy of all
the processors on the respective nodes is calculated. The “color code” indicator specifies the status of the CPU
busy on each of the processors of the respective nodes. If any of the CPUs are 90% or more busy, the indicator
turns into a ‘red triangle’. If any of the CPUs are 80%-89% busy, the indicator turns into a ‘yellow triangle’. The
indicator remains green when all the CPUs on the node are below 80% busy. Clicking on the indicator opens
the Performance Live screen with the CPU Busy graph for that node and the Top 10 Busiest Processes on the
node. In the event of a CPU that is down the indicator will show an exclamation mark inside of a yellow circle
. The CPU’s number, from ABA/ABB forward, will no longer simple fail to display. Clicking on the indicator
specifies that number.
In addition to the instantaneous CPU Busy information, the CPU Trend graph is also plotted. It is not possible
to traverse historically into the trend information as it shows the statistics only for the current monitoring
view.
When the CPU Busy panel is not shared with any other entity, then it is possible to view 7 resident gauges
simultaneously. If it is shared with another entity then up to 3 resident gauges are shown simultaneously. In
both cases, if the number of selected residents exceeds the “limit”, the gauges are aggregated into a single
gauge with average CPU Busy for all the nodes.
To note: If the ‘One Window per Node’ option is chosen the CPU Busy of each resident will appear as a bar
graph instead of a gauge. Its behavior will be exactly the same as in the case of ‘single resident’ which is
explained below.
In case of single residents: The CPU busy information is shown as a bar graph for each CPU. The bar is “color
coded” and specifies the status of the CPU busy on each of the processors. If CPU is 90% or more busy, the
corresponding bar turns red. For 80%-89% busy, the bar turns into yellow. The bar remains green when all the
CPU is below 80% busy.
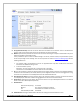
B. Process Busy: Displays the Top 10 busiest processes across a single node or multiple nodes depending on the
selection. The process information displayed is similar to the
Process Table.
C. Disk: Displays Top 10 busiest (in terms of I/Os per second) disks across a single node or multiple nodes
depending on the selection. I/O and Cache Hits per second are displayed.
D. NetLine:Displays Top 10 busiest (in terms of Total I/O Bytes per second) netlines across a single node or
multiple nodes depending on the selection. In addition to I/O Bytes, Read and Writes per seconds are also
displayed.
E. TMF:Displays a plot of the sum of Home Transactions and Home Net Transactions for each node.
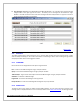
F. Events:Displays live EMS messages from the selected residents based on the source, selection criteria and
presentation settings. The view is similar to
Events Live Window with the exception of the toolbar options and
the ability to configure the view based on a Display Template. Token Dump and Acknowledge features work
similar to those in Events Live.
G. File:Displays IO operations per second and the number of reads and writes, respectively, which constitute the
total IO operations. This entity is not available for the G-series.