
Web ViewPoint User Guide, Version 5.14

Web ViewPoint User Guide Version 5.14 - 528226-014 141
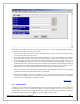
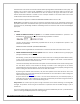
Click on the Submit button once your selections are made. The Live EMS Events Monitor Window will be
displayed based on your defined settings. These settings are also recorded in an xml file on your PC. This xml
file is read and applied again the next time you open an Event Live Setting Window. So the next time you go
into Events-Live there’s no need to browse through the tabs. Just press Submit, and the events will be
displayed according to the last saved settings. When the button ‘Save to file’ is clicked upon, the current
settings are saved to a temporary file. This setting is then displayed when the user comes back to the event
settings screen. The file saved is valid only for that particular browser session.
Click on the reset button resets the settings to what it was initially before the changes were made.
[Back to TOC]
5.5.2.2 EVENTS LIVE WINDOW
This Window maintains an On-line live connection with a dedicated EMS Distributor Process (FDIST) on the
NonStop Server. This process checks EMS messages as they are generated to determine if they meet your selection
criteria. For those that do, a copy is sent to this Window and is displayed at the bottom of the screen. You may
stop this flow of messages at any time by clicking on the icon on the upper right side of the screen. This
changes the icon to . You may click on this icon to restart the live stream of messages.
A Live Window can hold up to 500 EMS messages in the Events Monitor Window. It may be less when using a
customized display. There is an Event Settings feature Event display size under Presentation. The number that the
user inputs is the number of events they will see in the resulting Browser Window. The PARAM MAXEVENTS
controls and overrides this feature in that the PARAM will automatically change the number in the text box. Note
that all messages are maintained in the EMS log file(s) on the NonStop Server, and may be recalled and displayed
via the
Events Query feature.
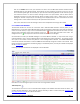
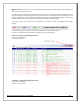
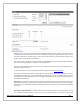
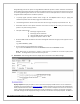
Following is a sample of how Events are displayed in the Live Window:
Information for each message occupies one row. Each row is organized as follows:
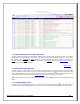
Token Dump icon:
The information icon here is a link to a Window which displays more detailed information about this Event. This
includes help text (description, cause, effect, & recovery methods), as well as a token dump. See
Displaying EMS
Event Help & Token Dump for more detail information.