
X25AM Configuration and Management Manual

SCF Commands for the X25AM Subsystem
X25AM Configuration and Management Manual—523424-004
4-54
Examples of the TRACE Command
Examples of the TRACE Command
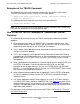
The following command starts a trace on the line, puts the results in a file named
TRCFILE, and selects the IOS, CLIPDI, CLIPDO trace options:
-> TRACE LINE $x25p1,TO trcfile, SELECT (IOS,CLIPDI,CLIPDO) &
-> PAGES 64, RECSIZE 2000
The following command stops the trace of the line named $X25P1:
-> TRACE LINE $x25p1, STOP
How to Use the TRACE Command to Troubleshoot X25AM
Problems
The following tips can help you use the TRACE command to troubleshoot X25AM
problems:
•
When recording trace data, use SELECT ALL if you want a general trace. If the
trace collector overruns, delete SELECT DR and SELECT IOS, to limit the traces
logged to the trace file only for the DRIVER or IOS modules.
•
The L2 option usually provides enough information to determine which end of the
line has a frame-level problem.
•
The L3 and L4 options usually provide enough information to determine whether
the application, the X25AM packet level, or the network packet level is causing the
problem. Look at the L3 and L4 levels first unless you strongly suspect a frame-
level problem.
•
When you troubleshoot a problem on a specific logical channel number (LCN), use
the FILTER LCN option. If you do not know the failing LCN, use the FIND
command to look at logon requests. You can use FILTER SDN 0 and RECORD
AFTER time to find incoming calls. Or you can use FILTER PACKET CALLS to list
both incoming and outgoing call requests.
•
When troubleshooting a problem with an application, use the FILTER SDN option.
To find the subdevice number, use the SCF STATUS SU command to display
subdevice status.
•
SCF traces application requests and responses at Layer 4. SCF labels requests
L4^LCB^IN. SCF labels responses L4WRITELINK. Use Table 4-8 on page 4-55 to
interpret the parameters in user requests; file-system internals are not included in
the table. The application buffer is not traced, but data packets contain most of the
application buffer contents.
For information on how to format your trace using PTrace, see Section 6, PTrace for
the X25AM Subsystem.
Note. You can also create a trace file with FUP. For example, FUP SET TYPE U, CODE 830,
EXT (100,100), MAXEXTENTS 978, BUFFERSIZE 4096.