
HP OneView 1.0 User Guide
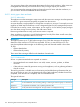
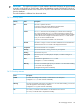
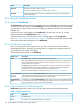
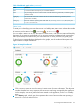

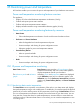
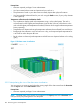

Table 9 Dashboard graph colors (continued)
IndicationColor
A critical condition that requires your immediate attentionRed
The percentage of resource instances that match the data being measured (a solid blue graph
indicates 100%)
Blue
The remainder of resource instances that do not match the data being measured (used in
combination with blue)
Light gray
Resource instances reporting status other than OK, Warning, or Critical, that is, they are
Disabled or Unknown
Dark gray
Status icons
To assist you in identifying resources that are not in a healthy state, status icons indicate the number
of resources with a status of OK ( ), Warning ( ), or Critical ( ).
You can select a status icon to view the resource’s main screen, with resource instances filtered by
that status. If no resources are defined or if no resource instances are detected with a particular
status (indicated by the number zero), the associated icon is nearly colorless (very pale gray).
To learn how to interpret the data displayed on the graphs, see the numbered descriptions that
appear after the sample dashboard.
Figure 14 Sample Dashboard
1
Click a resource name to view the resource’s main screen for more information. The adjacent
number identifies how many instances of that resource are being managed by the appliance.
In this example, one server profile has been created on the appliance, and it is in a healthy
state.
2
On a Status graph, a dark gray slice represents the count of resources that are reporting a
status of Disabled and Unknown.
24.4 Using the Dashboard screen 177