
9.5.01 HP P4000 SAN Solution User Guide (AX696-96168, February 2012)
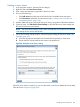
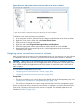
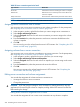
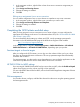
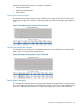
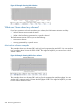
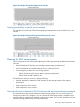


Figure 93 Example showing fault isolation
What can I learn about my volumes?
If you have questions such as these about your volumes, the Performance Monitor can help:
• Which volumes are accessed the most?
• What is the load being generated on a specific volume?
The Performance Monitor can let you see the following:
• Most active volumes
• Activity generated by a specific server
Most active volumes examples
This example shows two volumes (DB1 and Log1) and compares their total IOPS. You can see that
Log1 averages about 2 times the IOPS of DB1. This might be helpful if you want to know which
volume is busier.
Figure 94 Example showing IOPS of two volumes
This example shows two volumes (DB1 and Log1) and compares their total throughput. You can
see that Log1 averages nearly 18 times the throughput of DB1. This might be helpful if you want
to know which volume is busier.
208 Monitoring performance