
9.5.01 HP P4000 SAN Solution User Guide (AX696-96168, February 2012)
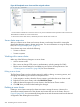
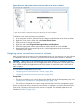
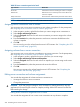
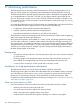
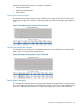
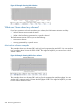
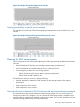


Figure 97 Example showing network utilization of three storage systems
Load comparison of two clusters example
This example illustrates the total IOPS, throughput, and queue depth of two different clusters (Denver
and Boulder), letting you compare the usage of those clusters. You can also monitor one cluster in
a separate window while doing other tasks in the CMC.
Figure 98 Example comparing two clusters
Load comparison of two volumes example
This example shows the total throughput for a cluster and the total throughput of each volume in
that cluster. You can see that the Log1 volume generates most of the cluster’s throughput.
210 Monitoring performance