
9.5.01 HP P4000 SAN Solution User Guide (AX696-96168, February 2012)
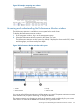
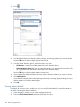
3. Right-click a row in the table and select View Statistic Details.
The Statistic Details window opens, with all of the information for the selected statistic that is
in the table, plus the statistic definition.
4. Click Close.
Removing and clearing statistics
You can remove or clear statistics in any of the following ways:
• Remove one or more statistics from the table and graph
• Clear the sample data, but retain the statistics in the table
• Clear the graph display, but retain the statistics in the table
• Reset to the default statistics
Removing a statistic
You can remove one or more statistics from the table and graph.
1. In the navigation window, log in to the management group.
2. Select the Performance Monitor node for the cluster you want.
3. Right-click a row in the table, and select Remove Statistics.
Use the CTRL key to select multiple statistics from the table.
4. Click OK to confirm.
Clearing the sample data
You can clear all the sample data, which sets all table values to zero and removes all lines from
the graph. This leaves all of the statistics in the table and selected for display. The graph and table
data repopulate with the latest values after the next sample interval elapses.
1. In the navigation window, log in to the management group.
2. Select the Performance Monitor node for the cluster you want.
3. Right-click anywhere in the Performance Monitor window, and select Clear Samples.
Clearing the display
You can clear the display, which removes all lines from the graph and deselects the Display option
for each statistic in the table. This leaves all of the statistics in the table, along with their data,
which continue to update.
1. In the navigation window, log in to the management group.
2. Select the Performance Monitor node for the cluster you want.
3. Right-click anywhere in the Performance Monitor window, and select Clear Display.
Resetting defaults
You can reset the statistics to the defaults, which removes all lines from the graph and sets the three
default statistics (cluster total IOPS, cluster total throughput, and cluster total queue depth) to zero
in the table. The default statistics are set to display and their data update when the next sample
interval elapses.
1. In the navigation window, log in to the management group.
2. Select the Performance Monitor node for the cluster you want.
3. Right-click anywhere in the Performance Monitor window, and select Reset to Defaults.
Removing and clearing statistics 219