
Performance and Recommended Use of AD385A 10 Gigabit Ethernet SR Cards
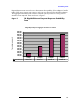
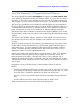
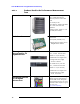

Table Of Contents

How We Measured 10 Gigabit Ethernet Efficiency
12
How We Measured 10 Gigabit Ethernet Efficiency
This article highlights the AD385A throughput. Throughput is the data transfer rate,
or the quantity of data transferred from one system to another in a given amount of time. In
this article, it’s shown for one-way transfers as well as two-way. Throughput measures how
well programs run with a certain workload and how quickly user requests can be handled.
This article also provides the Service Demand for each throughput test. Service demand is
the amount of time (in microseconds) it takes one CPU to handle one kilobyte of data. It is a
normalized measurement because it eliminates disparities due to differences in quantities,
types, or frequencies of CPUs. Service Demand is an important capacity planning &
performance metric that is sometimes considered when comparing different server models.
The performance results shown in this article were measured with the netperf benchmarking
software.
Tests were run with AD385A adapters installed in a 2-cell rx8640 with sixteen processors
(four dual-core processors in each cell). Adapters were installed in slots 3 and 4 on both
I/O bays.
The driver supports multi-queue using destination port based steering. It programs a card
resident table to look-up the destination port of the received packets and directs them to
appropriate queues. The driver updates the table dynamically as operating conditions
change. This feature provides good performance improvement when there is a mix of
applications that do not use the same destination port.
Details of the systems used and the software versions are shown in Table 2. The message
and socket sizes used with netperf for the 10 Gigabit Ethernet transmit, receive, and
bidirectional tests are as follows. 1500 MTU tests were run using a message size of
64Kbytes and socket size of 256K. At 9000 MTU, the tests used a message size of 128K
and socket size of 512K. TCP RR tests were run using a request size of 1-byte and a response
size of 1-byte.
Performance will vary when this product is used on different systems or software.
NOTES:
• The observed performance results are consistent across all of the same type of I/O slots
of the system; On HP Integrity rx8640, the high performance slots are slots 3, 4, 5 and
6 on each of the I/O Partitions. Performance on other slots will be lower.
• The core I/O card in the rx8640 carried minimal site LAN traffic during performance
tests.
• Processor affinity was used to assign netperf processes to specific CPUs.
Table 2 summarizes the products used to measure the performance: