
3Com Switch 8800 Advanced Software V5 Configuration Guide


98 CHAPTER 11: MSTP CONFIGURATION
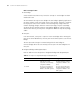
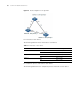
Figure 26 Network diagram for STP algorithm
■ Initial state of each device
The following table shows the initial state of each device.
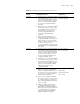
■ Comparison process and result on each device
The following table shows the comparison process and result on each device.
Tabl e 11 Initial state of each device
Device Port ID BPDU of the port
Switch A AP1 {0, 0, 0, AP1}
AP2 {0, 0, 0, AP2}
Switch B BP1 {1, 0, 1, BP1}
BP2 {1, 0, 1, BP2}
Switch C CP1 {2, 0, 2, CP1}
CP2 {2, 0, 2, CP2}