
Version 6 SuperStack 3 Switch 4400 Management Interface Reference Guide
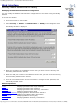

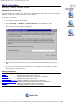
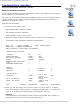
Table Of Contents
- 3com.com
- Contents
- Introduction
- Web Interface - Operations
- Command Line Interface - Commands
- Management Interface Reference Guide - Support
- Search the Reference Guide
- Introduction - Using the Reference Guide
- Introduction - Using the Web Management Interface
- Introduction - Using the Command Line Interface
- Support - Problem Solving
- Support - Internet Support
- Support - Email Support
- Support - Telephone Support
- Introduction - Using the Reference Guide - Introduction
- Introduction - Using the Reference Guide - Conventions
- Introduction - Using the Reference Guide - Sections
- Introduction - Using the Reference Guide - General Navigation
- Introduction - Using the Reference Guide - Related Documentation
- Introduction - Using the Reference Guide - Your Comments
- Introduction - Using the Reference Guide - Copyright and Trademarks
- Introduction - Using the Web Management Interface - Accessing the Web Interface
- Introduction - Using the Web Management Interface - Understanding the Web Interface
- Introduction - Using the Web Management Interface - The Banner
- Introduction - Using the Web Management Interface - The Toolbar
- Introduction - Using the Web Management Interface - The Navigation Tree
- Introduction - Using the Web Management Interface - The Information Area
- Introduction - Using the Web Management Interface - The Summary View
- Introduction - Using the Web Management Interface - The Device View
- Introduction - Using the Web Management Interface - The Help View
- Web Management Interface - System Getting Started
- Introduction - Using the Command Line Interface - Accessing the Command Line Interface
- Introduction - Using the Command Line Interface - Understanding the Command Line Interface
- Support - Problem Solving - Web Interface Problems
- Support - Problem Solving - Command Line Interface Problems
- Support - Problem Solving - VLAN Problems
- Support - Problem Solving - Link Aggregation Problems
- Support - Problem Solving - SNMP Management Software Problems
- Support - Problem Solving - Management Software Upgrade Problems
- Support - Problem Solving - Software Update Utility Problems
- Support - Problem Solving - RADIUS Problems
- Support - Problem Solving - Other Problems
- Web Management Interface - Security Device User Modify
- Web Management Interface - Physical Interface Ethernet Setup
- Web Management Interface - Physical Interface Ethernet Statistics
- Web Management Interface - Security Network Access Port Security
- Web Management Interface - System Console Setup
- Web Management Interface - System Unit Name
- Web Management Interface - System Unit Notepad
- Web Management Interface - Physical Interface Ethernet History History-1 Hour
- Web Management Interface - Physical Interface Ethernet History History-48 Hours
- Web Management Interface - Physical Interface Ethernet Port Setup Summary
- Web Management Interface - Protocol IP Setup
- Command Line Interface - system management password
- Command Line Interface - system management remoteAccess
- Command Line Interface - security device user pwdRecover
- Command Line Interface - security device user modify
- Web Management Interface - System Control Software Upgrade
- Software Update Utility - Recovering from a Failed TFTP Software Upgrade
- Web Management Interface - Security Network Access Port System Mode
- Command Line Interface - security device authentication systemMode
- Web Management Interface - Security Device Authentication System Mode
- Web Management Interface - Security Radius Retries
- Command Line Interface - security radius retries
- Web Management Interface - Security Device Authentication Logins
- Command Line Interface - physicalInterface ethernet portMode
- Web Management Interface - Physical Interface Ethernet Smart Autosensing
- Web Management Interface - Security Network Access Port Detail
- Web Management Interface - Security Network Access Port Summary
- Web Management Interface - Security Network Access Port System Summary
- Command Line Interface - system management contact
- Command Line Interface - system management location
- Command Line Interface - system management name
- Command Line Interface - security device user create
- Command Line Interface - security device user delete
- Command Line Interface - security device user summary
- 3Com Global Services & Support
- Web Management Interface - System Control Initialize
- Web Management Interface - System Control Reboot
- Software Update Utility - Using the Utility
- Command Line Interface - security device authentication logins
- Command Line Interface - security device authentication statistics
- Command Line Interface - security device authentication summary
- Command Line Interface - security radius setup
- Command Line Interface - security radius accounting display
- Command Line Interface - security radius accounting modify
- Command Line Interface - security radius authentication display
- Command Line Interface - security radius authentication modify
- Command Line Interface - security radius sharedSecret
- Command Line Interface - security radius summary
- Web Management Interface - Security Device Authentication Statistics
- Web Management Interface - Security Device Authentication Summary
- Web Management Interface - Security Radius Authentication Display
- Web Management Interface - Security Radius Authentication Modify
- Web Management Interface - Security Radius Shared Secret
- Web Management Interface - Security Radius Summary
- Command Line Interface - physicalInterface ethernet automdix
- Command Line Interface - physicalInterface ethernet detail
- Command Line Interface - physicalInterface ethernet flowControl
- Command Line Interface - physicalInterface ethernet portCapabilities
- Command Line Interface - physicalInterface ethernet portState
- Command Line Interface - physicalInterface ethernet smartAutosense
- Command Line Interface - physicalInterface ethernet summary

Command Line Interface - physicalInterface ethernet detail
http://support.3com.com/infodeli/tools/switches/4400/DHA1720-3AAA08/htmcli/physicalinterfaceethernetdetail.htm[11/15/2010 3:47:44 PM]
Command Line Interface
physicalInterface ethernet detail
Displaying Detailed Information
You can display detailed information and statistics about a single Ethernet port using the
detail command on the ethernet menu.
The values are automatically refreshed and updated every 10 seconds. The detail screen
can be changed from the default Counters display to either Differences, Rates/Sec, or
Utilizations, as detailed in step 3.
To display the information:
1. At the Top-level menu, enter:
physicalInterface ethernet detail
The following prompt is displayed:
Select Ethernet port (unit:port,?):
2. Enter the number of the unit and port that you wish to learn more about.
An example of the information displayed is shown below:
Port: 1:2 State: enabled Mode: 100full (Auto)
Media Type: 10 BASE-T/100 BASE-TX
Active Features: Secure Mode, BSC Enabled
Refresh Time:10 Seconds
-Counters- Rx Tx
Unicast Packets: 14260 467
Non Unicast Packets: 52706 18387
Octets: 6054979 2357880
Fragments(Rx)/Collisions
(Tx):
0 0
Discarded Packets(Rx): 6 -
-Errors-
Undersize: 0 Oversize: 0
CRC Error: 0 Jabbers: 0
-Pkt Analysis-
64 Octets: 34404
256 to 511
Octets:
328
65 to 127 Octets: 16040
512 to 1023
Octets:
4
128 to 255 Octets: 35051
1024 to 1518
Octets:
7
Quit Counters Differences Rates/Sec Utilizations
3. Enter Q to quit and return to the previous menu. Or you can enter C: to display
the Counter values for all the fields, D: to display the differences, R: to display the
rates, or U: to display the utilizations as a percentage for the port.
Counters
These statistics are the etherstat counters taken from the MIB. The Counters run
continually from the time the unit was last powered up.