
HP ProCurve Threat Management Solution Design Guide 2009-04

4-24
Design
Follow an Iterative Design Process
Second and Subsequent Times Through the Process
Perform the following tasks to enable threat response on your network.
Define Actions. Use the Actions section of Policy Manager to define actions. These actions
should match the responses on the list you generated in step 1.
Define Policies. Use the Policies section of Policy Manager to define policies that match
alerts to actions, according to the list of events and responses you generated in step 1. Make
sure that you enable the policies you want to use to respond to threats.
Step 4: Analyze Events
First and Subsequent Times
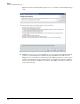
Set up Reporting. The event log is always available in the Events window in PCM+. In
addition, you can set up automatic generation of a variety of security reports or run the reports
manually.
These reports relate to NIM:
■ Alert Activities—shows information about each alert that has occurred
■ Alert Distribution by Device—shows the number of alerts that have been triggered on
each device and the severity of those alerts
■ Alerts by Device and Offender—shows the number of alerts that have been triggered by
each offender on each device and the severity of those alerts
■ Alerts Not Handled—shows alerts that have been triggered but have not triggered an action
in response
■ Most Active Alerts—shows the alerts that have been triggered most often
■ Most Active Offenders and Alerts by Severity—shows the offenders who have triggered
the most alerts and the number of alerts that they have triggered of each severity level
■ Most Enforced Security Actions—shows the actions that have been enforced most often
■ Network Activity by Offender IP Range—shows the alerts and actions triggered by
offenders within a certain IP range
If you have a TMS zl Module in your Threat Management Solution, you can also run TMS zl IPS
reports, which list the security threats detected by the TMS zl Module’s IPS. PCM+ provides
reports on the module’s firewall functions as well.
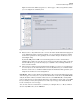
Use the Dashboard, Events Window and Reports to Analyze Events. Use the Network
Immunity Manager Dashboard, the Events window, and reports to assemble information about
threat activity on your network. This is a simple statement of a complex task. Look for patterns
of activity based on location, time, type of event, and so on. For a large network, you may find
it useful to break the network down into smaller segments and analyze those units individually.
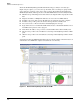
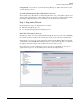
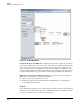
Run the NBAD Diagnostic Wizard. As mentioned earlier, you can use the NBAD Diagnostic
Wizard to analyze NBAD events. In addition to helping you identify the likelihood of false
positives for each NBAD event, this wizard provides detailed information about both the threat
and the offender. Figure 4-15 shows the wizard’s analysis of a TCP Null Flags event.