
HP ProCurve Threat Management Solution Implementation Guide 2009-05

3-82
HP ProCurve Network Immunity Manager with a Third-Party IDS/IPS
Step 2: Detect Threats
For the example network, the entire command sequence is listed below:
config system interface
edit wan2
set arpforward disable
set ips-sniff-mode enable
set ips-sniff-signature info low medium high critical
set ips-sniff-anomaly info low medium high critical
end
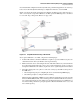
8. Connect a cable from the sniffer port of the UTM device to the switch. Now that Address
Resolution Protocol (ARP) forwarding on the sniffer port has been disabled, connecting
the cable will not cause a loop.
9. Configure virtual LANs (VLANs) on the switch port that connects to the UTM’s sniffer port.
For the UTM to receive mirrored traffic from attackers and victims on the network, the
switch port must be a member of all VLANs to which those attackers and victims are
connected. (If you have multiple VLANs on your network, configure the switch port as a
member of each VLAN where attacker or victim traffic might originate.)
10. Set up mirroring to copy traffic from a selected port (or ports) to the UTM device. This
might be either local mirroring (source and destination ports are on the same switch) or
remote mirroring (source and destination ports are on different switches). Note that while
local mirroring is available on most ProCurve switches, remote mirroring is available only
on selected ProCurve switches. For instructions on setting up static mirroring, refer to
“Task: Set Up Static Mirroring, as Needed” on page 3-25.
11. Optionally, test the IDS setup to verify that it is functioning properly.
a. Generate events. You can use port-scanning software, such as NMAP (which is
available from www.insecure.org), to probe the ports on your network in such a way
that the UTM device detects it as malicious traffic. Alternatively, you can use the ping
method described in “Optional Subtask: Set Up the UTM Device for IPS Operation” on
page 3-74.
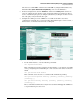
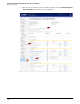
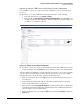
b. Check the UTM device for events. You can see the events in two different places:
– For a quick indication of event activity, you can view the Attack Log panel on the
System Status window. The IPS line in the Attack Log shows the number of events
logged. (These are from the IDS, even though the line reads IPS.) You can update
the report by refreshing the window. (Click Status under the System tab in the left
navigation bar.) If you want to see details of the events, click Details at the end of
the IPS line.
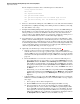
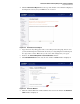
– Alternatively, you can check the UTM device’s log window. Click the Log & Report
tab in the left navigation bar; click Log Access; click the Memory tab; and in the Log
Type list at the top of the report, select Attack Log. The detailed log of attacks is
displayed.
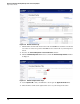
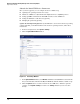
c. Verify that PCM+ receives the events. The PCM+ Event window shows events that the
UTM device forwards as SNMP traps. To see the event in the PCM+ event log, complete
these steps:
i. Select a group or device in the navigation tree.
ii. Click the Events tab in the main panel. This displays the PCM+ event log.
iii. Your event will be in the log, but given the number of events that PCM+ logs,
knowing the time the event occurred on the UTM device (and having the UTM
device and PCM+ synchronized) will help you to locate it. In addition, the name
of the signature or anomaly reported in the UTM device’s event log is passed to
PCM+ in the SNMP trap. You can find the event quickly by entering that name in
the Description field in the Filters section of the PCM+ event log.