
HP ProCurve Threat Management Solution Implementation Guide 2009-05

3-105
HP ProCurve Network Immunity Manager with a Third-Party IDS/IPS
Step 2: Detect Threats
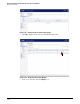
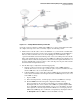
Figure 3-112. A Sample Network Showing an Inline IPS
So far, the setup procedure has configured the UTM device to detect and log malicious traffic.
To complete the setup of the device as an IPS, complete the following actions:
1. Make sure the network cables connect the UTM device to your network as an inline IPS.
In the example setup, the data center is connected to the X1 (WAN) port on the UTM device.
The rest of the network is connected to the X0 (LAN) port on the UTM device. (For
operation of the IPS it doesn’t matter which port is connected to which part of the network.
These port assignments were used because the UTM device’s Web browser interface was
designed to interact with the management station’s browser through the LAN interface. It
therefore simplified the setup procedure to connect the X0 port to the part of the network
that included the management station.)
2. Test the IPS setup to verify that it is functioning properly.
a. Generate events. You can use port-scanning software, such as NMAP (which is
available from www.insecure.org), to probe the ports on your network in such a way
that the UTM device detects it as malicious traffic.
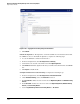
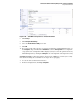
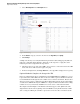
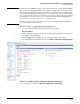
b. Verify that PCM+ sees the events. The event log in PCM+ shows events from the UTM
device that are forwarded to the management station as SNMP traps. To see the event
in the PCM+ event log:
i. Log in to PCM+.
ii. In the left navigation tree, click the group to which your UTM device belongs.
iii. Click the Events tab in the main panel to display the PCM+ event log.
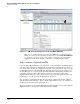
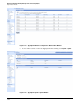
Your event will be in the log, but given the number of events that PCM+ logs,
knowing the time the event occurred on the UTM device (and having the UTM
device and PCM+ synchronized) will help you to locate it. In addition, the name
of the signature or anomaly reported in the UTM device’s event log is passed to
PCM+ in the SNMP trap. You can find the event quickly by entering that name in
the Description field in the Filters section of the PCM+ event log.