
TMS zl Management and Configuration Guide ST.1.0.090213

3-36
Initial Setup in Monitor Mode
Configuring Management Access
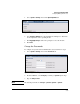
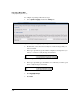
System Resources
CPU Usage Percentage of TMS zl Module processor
cycles being used
n/a
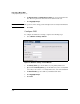
Memory Usage Percentage of real and cached memory
being used on the TMS zl Module. High
memory usage during low activity periods
does not necessarily signal a problem; the
cache memory may not have flushed
recently.
n/a
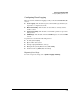
Latest Critical Alerts
List of alerts with the severity level of
Critical, with the most recent alert at the
top
n/a; See all alerts on
System > Logging > View Log
Network Interfaces
Name Name of the TMS port. n/a
Status UP or DOWN; describes whether the
interface is functioning
n/a
IP/mask The IP address and network mask for the
TMS zl Module's interface on the port.
See “Configure Initial Settings” on page 3-26.
Received Number of kilobytes per second that are
being received on the interface
n/a
Sent Number of kilobytes per second that are
being sent on the interface
n/a
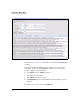
Intrusion Detection
Packets Inspected Number of packets per second that the IDS
is currently inspecting
n/a
Critical Events Number of critical events per second that
the IDS is currently logging]
n/a
Severe Events Number of severe events per second that
the IDS is currently logging
n/a
Warning Events Number of warning events per second that
the IDS is currently logging
n/a
Info Events Number of information events per second
that the IDS is currently logging
n/a
Field Description How to Configure