
TMS zl Management and Configuration Guide ST.1.1.100430

3-35
Initial Setup in Monitor Mode
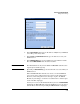
Access the Web Browser Interface
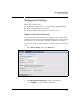
■ Click the Delete icon to remove an object.
■ Click the Edit icon to edit an object.
The Delete and Edit icons are called “Tools.”
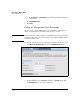
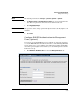
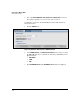
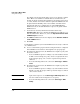
Dashboard
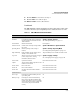
The TMS zl Module’s dashboard displays module settings and real-time statis-
tics. The refresh rate (nonconfigurable) for the dashboard is four seconds.
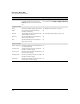
Table 3-7. TMS zl Module Dashboard Information
Field Description How to Configure
System Information
Hostname User-defined module name (maximum of
60 ASCII characters). Default: ProCurve-
TMS-zl-Module
System > Settings > General
See “Management Settings” on page 3-37.
Serial Number Module serial number Preconfigured
Software Version Number of the currently running Product
OS version
System > Maintenance > Update Software
Operating Mode Module operating mode (routing or
monitor)
System > Settings > Operating Mode
See “Change the Operating Mode” on page 3-46
High Availability High availability cluster scheme (active-
standby or none) Default: none.
*High availability is not available in monitor mode.
Log Level Which severity level of events are logged
(critical, major, minor, warning,
information) Default: critical
System > Logging > Settings
See “Configuring Event Logging” on page 3-48
Current Time System date and time Derived from the host switch.
Uptime Amount of time that has elapsed since the
module was last booted
n/a
Chassis Name Host switch name Derived from the host switch.
Chassis IP Host switch IP address Derived from the host switch.
Chassis Slot Slot letter where the TMS zl Module is
installed
Derived from the host switch.
System Resources
CPU Usage Percentage of TMS zl Module processor
cycles being used
n/a
Memory Usage Percentage of real and cached memory
being used on the TMS zl Module. High
memory usage during low activity periods
does not necessarily signal a problem; the
cache memory may not have flushed
recently.
n/a