
TMS zl Management and Configuration Guide ST.1.2.100916


2-53
Initial Setup in Routing Mode
Access the Web Browser Interface
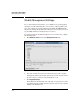
Systems Graphs. The System > Dashboard > Systems Graphs page provides
four graphs:
■ CPU Usage—displays the percentage of CPU used by the operating
system (indicated in blue) and user processes (indicated in gray). Oper-
ating system includes time spent on data-path packet processing. User
includes processes such as user authentication, configuration, and the
establishment of VPN connections.
■ Memory Usage—displays the percentage of RAM used.
■ Data Interface—displays data received and transmitted in bits per
second.
■ HA Interface—displays data received and transmitted on the High-
Availability (HA) interface in bits per second.
Note If the HA Interface graph shows traffic but you have not configured an HA
cluster, check the VLAN settings for an HA cluster. (See “Configuring High
Availability” on page 8-8 in Chapter 8: “High Availability.”) By default, the HA
VLAN is VLAN 1 and will receive broadcast traffic distributed on that VLAN.
Even if you do not create an HA cluster, HP recommends that you change the
default HA VLAN (VLAN 1) to a dedicated VLAN that does not carry general
data traffic. This HA VLAN should not be associated with a zone, and the host
switch should not have an IP address on the HA VLAN.
You can view each graph by day, by week, by month, or by year. The following
example graphs show usage by day.
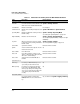
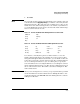
Transmitted Number of kilobytes per second and
packets per second that are being sent on
the interface
n/a
Received +
Transmitted
Number total of kilobytes per second and
packets per second that are being sent and
received on the interface
n/a
Field Description How to Configure