
TMS zl Management and Configuration Guide ST.1.2.100916


2-55
Initial Setup in Routing Mode
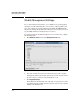
Access the Web Browser Interface
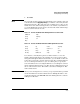
The resolution for the graphs is one sample per minute. That is, each data point
on the graph represents one sample, which was taken at some point within a
one-minute period.
Such sampling provides meaningful information over a period of time but
should not be used for short-term analysis. That is, you should not use one
data point or even the data for one hour to make decisions regarding your
module or your network.
You can, however, use the system graphs to identify trends about your mod-
ule’s CPU usage, memory usage, data interface traffic, and HA interface traffic.
This trending information can help you with:
■ Capacity planning
■ Diagnostics
For example, you can use the graphs to identify peak usage periods, determine
if the module is continuously experiencing heavy usage, or predict the net-
work traffic and usage for upcoming months. This information can help you
take the steps necessary to improve performance now or plan for future
growth and increased utilization.
You can also use the system graphs to help diagnose the cause of a problem
should one occur. For example, if you notice a general network slow down,
you can check the system graphs—particularly the CPU Usage and Data
Interface graphs—to determine if there is a sharp increase in either CPU usage
or interface traffic. If there is no real change in either, you may want to check
other devices to determine what is causing the network slowdown.
However, if you see a significant change in either CPU usage or interface
traffic, you can use other TMS zl Module tools to investigate further. For
example, you can use the Dashboard Summary and Network Interfaces tabs to
gather more information about CPU usage and interface traffic. (If you have
configured a dedicated HA VLAN that is not associated with a zone, informa-
tion about this VLAN will not be shown on the Network Interfaces tab.)
In addition, you can:
■ View log messages to see if there is abnormal activity such as an attack
■ Access the TMS zl Module’s command line interface (CLI) and enter the
show connections and show zone commands to view more detailed infor-
mation about the traffic the TMS zl Module is currently handling