
TMS zl Management and Configuration Guide ST.1.2.100916

3-36
Initial Setup in Monitor Mode
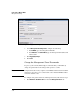
Access the Web Browser Interface
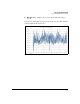
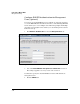
Systems Graphs. The System > Dashboard > Systems Graphs page provides
three graphs:
■ CPU Usage—displays the percentage of CPU used by the operating
system (indicated in blue) and user processes (indicated in gray). Oper-
ating system includes time spent on data-path packet processing. User
includes processes such as user authentication, configuration, and the
establishment of VPN connections.
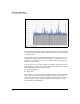
■ Memory Usage—displays the percentage of RAM used.
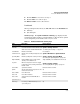
Memory Usage Percentage of real and cached memory
being used on the TMS zl Module. High
memory usage during low activity periods
does not necessarily signal a problem; the
cache memory may not have flushed
recently.
n/a
Latest Critical Alerts
List of alerts with the severity level of
Critical, with the most recent alert at the
top
n/a; See all alerts on
System > Logging > View Log
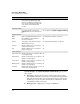
Network Interfaces
Name Name of the TMS zl Module physical port See “Ready the Host Switch” on page 3-8.
Status UP or DOWN; describes whether the
interface is functioning
n/a
IP/mask The IP address and network mask for the
TMS zl Module on the port.
See “Configure Initial Settings” on page 3-25.
Received Number of kilobytes per second that are
being received on the port
n/a
Sent Number of kilobytes per second that are
being sent on the port
n/a
Intrusion Detection
Packets Inspected Number of packets per second that the IDS
is currently inspecting
n/a
Critical Events Number of critical events per second that
the IDS is currently logging
n/a
Severe Events Number of severe events per second that
the IDS is currently logging
n/a
Warning Events Number of warning events per second that
the IDS is currently logging
n/a
Info Events Number of information events per second
that the IDS is currently logging
n/a
Field Description How to Configure