3-37
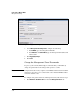
Initial Setup in Monitor Mode
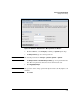
Access the Web Browser Interface
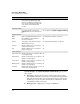
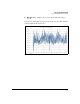
■ Data Interface—displays data received and transmitted in bits per
second.
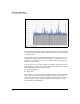
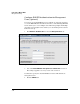
You can view each graph by day, by week, by month, or by year. The following
example graphs show usage by day.
Figure 3-17. CPU Usage Graph