
TMS zl Management and Configuration Guide ST.1.2.100916

3-38
Initial Setup in Monitor Mode
Access the Web Browser Interface
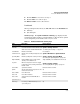
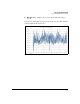
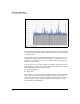
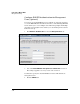
Figure 3-18. Data Interface Graph
The resolution for the graphs is one sample per minute. That is, each data point
on the graph represents one sample, which was taken at some point within a
one-minute period.
Such sampling provides meaningful information over a period of time but
should not be used for short-term analysis. That is, you should not use one
data point or even the data for one hour to make decisions regarding your
module or your network.
You can, however, use the system graphs to identify trends about your mod-
ule’s CPU usage, memory usage, data interface traffic, and HA interface traffic.
This trending information can help you with:
■ Capacity planning
■ Diagnostics
For example, you can use the graphs to identify peak usage periods, determine
if the module is continuously experiencing heavy usage, or predict the net-
work traffic and usage for upcoming months. This information can help you
take the steps necessary to improve performance now or plan for future
growth and increased utilization.