
TMS zl Management and Configuration Guide ST.1.2.100916

3-39
Initial Setup in Monitor Mode
Management Settings
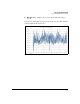
You can also use the system graphs to help diagnose the cause of a problem
should one occur. For example, if you notice a general network slow down,
you can check the system graphs—particularly the CPU Usage and Data
Interface graphs—to determine if there is a sharp increase in either CPU usage
or interface traffic. If there is no real change in either, you may want to check
other devices to determine what is causing the network slowdown.
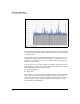
However, if you see a significant change in either CPU usage or interface
traffic, you can use other TMS zl Module tools to investigate further. For
example, you can use the Dashboard Summary to gather more information
about CPU usage and interface traffic. In addition, you can view log messages
to see if there is abnormal activity such as an attack.
Management Settings
This section describes how to:
■ Modify the IP settings used to access and manage the TMS zl Module
■ Change management users’ passwords
■ Configure RADIUS authentication for management users
Modify the Module’s IP Settings
To access the Web browser interface, you configured a set of management
settings. You assigned a management VLAN and IP address, as well as a default
gateway. But you can change these settings in the Web browser interface.
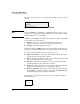
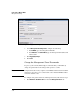
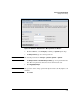
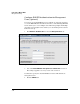
To view or change the module’s management settings, complete the following
steps.
1. Select System > Settings and click the General tab.