
WESM zl Management and Configuration Guide WT.01.XX and greater

12-15
Wireless Network Management
Monitoring the Wireless Network
Viewing a Graph of Wireless Station Statistics
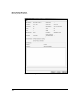
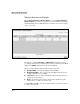
The Wireless Edge Services zl Module can create a graph of statistics for a
wireless station. This graph displays how the statistics change over time.
To view this graph, follow these steps:
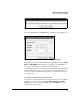
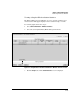
1. Select Device Information > Wireless Statistics.
2. Select the station (identified by MAC address) from the list.
Figure 12-8. Graph Button in the Device Information > Wireless Statistics Screen
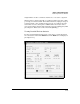
3. Click the Graph button. The Station Statistics screen is displayed.
Graph button