
WESM zl Management and Configuration Guide WT.01.XX and greater

12-16
Wireless Network Management
Monitoring the Wireless Network
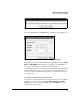
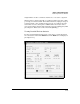
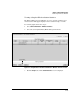
Figure 12-9. Station Statistics Graph
The Station Statistics screen displays the station’s MAC address and IP address
in the upper right corner.
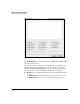
To generate a graph, you must select the statistic that you want to track.
(Initially, the graph shows packets per sec.) You can choose any of the
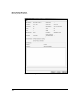
statistics displayed in the Details screen (refer to “Viewing Details about a
Wireless Station” on page 12-7 for more information on a statistic):
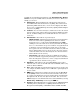
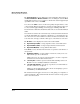
■ Pkts per sec—total packets transmitted and received by this station per
second
• TX Pkts per sec—packets transmitted by this station per second
• RX Pkts per sec—packets received by this station per second