
WESM zl Management and Configuration Guide WT.01.XX and greater

12-32
Wireless Network Management
Monitoring the Wireless Network
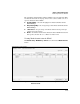
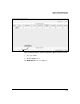
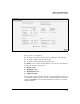
Figure 12-21.WLAN Statistics Graph
The WLAN Statistics screen displays the WLAN’s SSID and static VLAN ID in
the upper right corner.
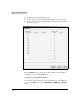
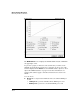
To generate a graph, you must select the statistic that you want to track.
(Initially, the graph shows packets per second.) You can choose any of the
statistics displayed in the Details screen for WLAN statistics. (Refer to “View-
ing Detailed WLAN Statistics” on page 12-28 for more information on a
statistic.) The statistics apply to all radios and stations associated to the
WLAN.
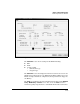
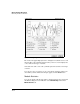
You can choose:
■ Pkts per sec—total packets transmitted and received in this WLAN per
second
• TX Pkts per sec—packets transmitted in the WLAN per second
• RX Pkts per sec—packets received in this WLAN per second