
WESM zl Management and Configuration Guide WT.01.XX and greater

12-34
Wireless Network Management
Monitoring the Wireless Network
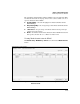
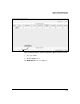
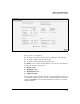
Figure 12-22.Comparing WLAN Statistics
The x-axis of the graph displays the time—in Figure 12-22, marked at 5 second
intervals. The y-axis adds a label that matches your choice. It also displays the
correct units for that type of statistic.
A line that is the same color as the y-axis label plots the statistic as it changes
over time.
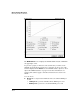
You can select up to four boxes at once and compare statistics against each
other. When you have finished viewing the graph, click the Close button.
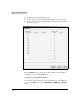
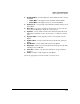
Module Statistics
You can also monitor all wireless traffic to and from stations associated with
this Wireless Edge Services zl Module. Select Network Setup and click the
Module Statistics tab.