
ProLiant BL p-Class GbE Interconnect Switch Web-based Interface Reference Guide

Configuring the GbE Interconnect Switch using the Web-based Interface
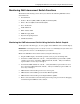
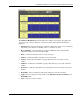
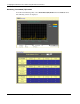
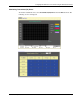
The Tx Packets Analysis window displays the number of bytes and packets successfully sent
from the port. The following information is displayed:
•
•
•
•
•
•
•
Time Interval—Select the frequency at which the information on the screen is refreshed.
The setting can be between 1s and 60s, where “s” stands for seconds. The default value is
one second.
Record Number—Select the number of times the GbE Interconnect Switch will be
polled. The setting can be between 20 and 200. The default value is 20.
Bytes—Counts the number of bytes successfully sent from the port.
Packets—Counts the number of packets successfully sent from the port.
Show/Hide—Select to display or hide bytes and packets information.
Apply—Select to apply any changes made to the Time Interval, Record Number, and
Show/Hide fields.
Clear—Select to reset the counters.
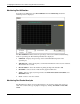
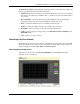
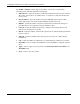
Monitoring Port Error Packets
The Web manager allows port error statistics compiled by the management agent of the GbE
Interconnect Switch to be viewed as either a line graph or a table. You can select the type of
graphic to display by clicking View Table or View Line Chart.
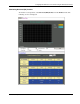
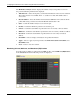
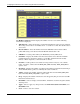
Monitoring Received (RX) Errors
To monitor received errors, select Received (RX) Errors from the Errors menu. The
following screens are displayed.
HP ProLiant BL p-Class GbE Interconnect Switch Web-based Interface Reference Guide 2-53