
ProLiant BL p-Class GbE2 Interconnect Switch ISCLI Reference Guide


Statistics commands 78
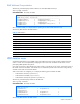
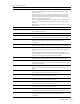
The following table describes the NTP statistics:
Table 69 NTP statistics
Statistics Description
Primary Server Requests Sent: The total number of NTP requests the switch sent to the primary NTP
server to synchronize time.
Responses Received: The total number of NTP responses received from the primary
NTP server.
Updates: The total number of times the switch updated its time based on the NTP
responses received from the primary NTP server.
Secondary Server Requests Sent: The total number of NTP requests the switch sent to the secondary NTP
server to synchronize time.
Responses Received: The total number of NTP responses received from the secondary
NTP server.
Updates: The total number of times the switch updated its time based on the NTP
responses received from the secondary NTP server.
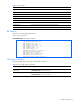
Last update based on
response from primary
server
Last update of time on the switch based on either primary or secondary NTP response
received.
Last update time The time stamp showing the time when the switch was last updated.
Current system time The switch system time when the command show ntp counters was issued.
Uplink Failure Detection statistics
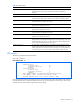
These commands allow you to display Uplink Failure Detection (UFD) statistics.
show ufd counters
Command mode: All
Uplink Failure Detection statistics:
Number of times LtM link failure: 1
Number of times LtM link in Blocking State: 0
Number of times LtD got auto disabled: 1
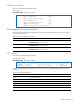
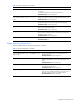
The following table describes the Uplink Failure Detection (UFD) statistics:
Table 70 Uplink Failure Detection statistics
Statistic Description
Number of times LtM link failure The total numbers of times that link failures were detected on the
uplink ports in the Link to Monitor group.
Number of times LtM link in Blockin
g
State
The total number of times that Spanning Tree Blocking state was
detected on the uplink ports in the Link to Monitor group.
Number of times LtD got auto
disabled
The total numbers of times that downlink ports in the Link to Disable
group were automatically disabled because of a failure in the Link
to Monitor group.
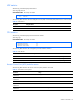
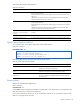
Statistics dump
The following command dumps GbE2 statistics:
show counters
Command mode: All
Use the dump command to dump all switch statistics available (40K or more, depending on your configuration). This
data can be used to tune or debug switch performance.
If you want to capture dump data to a file, set your communication software on your workstation to capture session
data prior to issuing the dump commands.