
ISS Technology Update, Volume 8, Number 2


ISS Technology Update Volume 8, Number 2
2
Table 1-1. VMmark workload summary per tile
Workload
Application
Virtual Machine Platform
Mail server
Exchange 2003
Windows 2003, 2 CPU, 1 GB RAM, 24 GB disk
Java server
SPECjbb2005-based
Windows 2003, 2 CPU, 1 GB RAM, 8 GB disk
Web server
SPECweb2005-based
SLES 10, 2 CPU, 512 MB RAM, 8 GB disk
Database server
MySQL
SLES 10, 2 CPU, 2 GB RAM, 10 GB disk
File servers
dbench
SLES 10, 1 CPU, 256 MB RAM, 8 GB disk
Standby server
None
Windows 2003, 1 CPU, 256 MB RAM, 4 GB disk
To ensure the benchmark‘s standardization, VMmark specifies how each virtual machine is configured, including memory, disk,
and number of CPUs. This is also shown in Table1.
Client systems are also required to drive the workloads on the tile of the server under test. Each tile requires a separate client
system, and the configuration and software to be run on the client is also strictly defined.
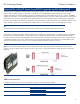
Calculating a Tile’s performance
A VMmark test run is designed to last for three hours. During this time, the system collects metrics on the performance of each of
the five virtual machines in the tile that are actually running workloads. The results for each virtual machine are then compared
against those obtained when running a single tile on VMmark‘s defined reference system to generate a normalized
performance ratio for each virtual machine. Finally, a geometric mean of these five numbers is taken to arrive at the
performance score for the tile. Because the performance numbers are taken as ratios against the VMmark reference platform,
tile performance scores tend to gravitate around one. In fact, since the reference system for all VMmark results is defined as an
HP ProLiant DL580 G2, the performance score for a DL580 G2 running a single tile is exactly 1.00.
Running multiple tiles
The VMmark benchmark can be set up to run a single tile or multiple tiles. Deciding how many tiles a given platform is capable
of running is an empirical determination; however, platforms with more processors and more cores can generally run more tiles.
When running more than one tile, the performance results from all of the tiles are totaled to generate an overall performance
score for the test. VMmark scores are always represented by two numbers – the aggregate performance scores of all the tiles
and the number of tiles run. A typical VMmark score for a system would be stated as 10.00 @ 7 tiles.
Interpreting VMmark results
Interpreting VMmark results requires looking at both numbers within the score. Clearly, when comparing two systems tested with
the same number of tiles, the system with the higher performance score (left number) has achieved a better result. Overall, the
ability to run more tiles is the more important metric since it indicates a platform‘s ability to run more concurrent workloads than
other systems. Also, higher performance scores will almost always correlate with higher numbers of tiles.
Because it is focused on virtualization performance, VMmark is essentially a processor and core bound benchmark. Systems
with greater numbers of processors and cores will generally outperform those with fewer. While the amount of physical memory
installed can make some difference, any installed memory greater than the five to six gigabytes required for each tile that the
processor complex is capable of supporting is of little or no benefit. Table 2, which contains the latest VMmark results for
several HP ProLiant servers, illustrates the difference that more processors and cores make in overall virtualization performance.