
HP SmartCache technology

Technical white paper | HP SmartCache
8
% writes 11 12
Average IOPS, Read 4,382 19,464 (over 4x better)
Average IOPS, Write 550 2,650 (almost 5x better)
Duration (seconds) 6644 7201
I/O distribution (reads)
Count
Avg. latency (msec)
Count
Avg. latency (msec)
0% @ 4K
0 0.00 0 0.00
97.6% @ 8K
28,430,311 27.97 140,159,417 6.23
0% @ 16k
71 28.21 0 0.00
<1% @ 32K
1,457 21.54 0 0.00
2.3% @ 64K
682,201 18.79 0 0.00
0% @ 128K
0 0.00 0 0.00
0% @ 256K
0 0.00 0 0.00
100% (totals)
29,114,040 27.75 140,159,417 6.23
I/O distribution (writes)
Count
Avg. latency (msec)
Count
Avg. latency (msec)
<1% @ 4K 93 10.18 98 45.39
82.9% @ 8K 3,028,218 0.13 18,015,518 89.35
16% @ 16K 585,670 0.15 1,031,087 89.27
<1% @ 32K 18,322 0.22 18,745 89.90
<1% @ 64K 13,607 0.29 11,419 90.06
<1% @ 128K 5,856 0.36 2,326 90.01
<1% @ 256K 1,209 0.46 427 90.10
100% (totals) 3,652,975 0.13 19,079,620 89.35
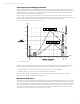
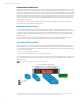
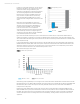
Taking a closer look at the data from Table 1, we see that the transaction volume through the database logical drive
increased significantly with HP SmartCache. As shown in Figure 6, the disk subsystem without SmartCache was able to
perform approximately 29 million reads and 3.6 million writes (blue). With HP SmartCache, the disk subsystem performance
increased significantly to approximately 140 million reads and 19 million writes (gray) within roughly the same period. With