
HP Reference Information Storage System v1.6 Administrator Guide (T3559-96073, July 2007)

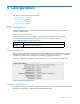

• Start: Star t a single machine, start all ma chines, or start all machines in a selected server
group.
• Stop: Stop a single machine, stop all machines, or stop all machines in a selected server
group.
• Restart: Stop and immediately start a single machine, or stop and immediately start all
machines or all machines in a selected ser ver group.
• Staggered Restart: Restart all machines in sequence, or all ser ver g roup machines in
sequence, with a minimum of downtime.
NOTE:
StaggeredRestartcanonlybeusedwithsmartcell,HTTP,andmetaservers.
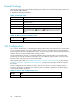
2. Toperformanactiononallmachinesinaservergroup:
a. Click Machine Type.
b. SelectthetypeofserverfromtheMachineTypedrop-downlist.
3. To per form an action on a particular m achine:
a. Click Machine.
b. Select the machine in the Hostname column.
4. Click Run Now!
Performance Graph
Use this view to create graphs showing different types of system events over specified time periods. You
can generate two categories of graphs:
• System monitoring graphs tha t show idle CPU usage, free memory usage, or the number of
threads used.
• Appliance storage and indexing graph s that show the number of documents stored or indexed o n
the system, and the rate at which documents are stored or indexed per second.
Table 16 Performance Graph features
Feature
Description
Heading
Thetypeofgraphortheservername.
Event History
Thegraphedeventhistoryoverthereportedtimeperiod.
Time
Thetimeperiodbeingreported.
Table 17 Link to Performance Graph view
Origin
Link
left menu Performance Graph
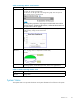
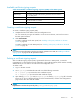
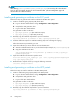
Example: Appliance Store graph
An example of an appliance store or indexing performance graph is shown below. This graph charts the
Domain1 store rate for today at fiv e minute intervals.
34
System Status