
HP A7173A PCI-X Dual Channel Ultra320 SCSI Host Bus Adapter Performance White Paper for HP PA-RISC Servers

3
Test Results
All performance data was obtained using “Diskbench” (DB), an I/O performance measurement tool.
For all I/Ops testing, a standard DB block-size of 1KB was used, while throughput required a standard
DB block-size of 256KB. The overall throughput of a storage solution helps model large, sequential
data transfers similar to a remote backup system, a multimedia file-server, or any other system which
must simultaneously transfer large amounts of data. Alternately, I/Ops metrics help model small,
transactional I/O operations usually found in databases.
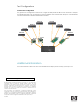
For all I/Ops, throughput, and service demand tests, the test environment configuration was as follows:
one A7173A dual-channel Ultra320 SCSI adapter, and one A6829A dual-channel Ultra160 SCSI
adapter connected to two MSA30 SB disk storage units. Each MSA30 SB contained thirteen HP15K
RPM U320 SCSI hard disks.
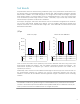
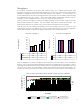
I/Ops
Chart 1a: I/Ops Chart 1b: CPU Utilization
0
20,000
40,000
60,000
80,000
I/ O ' s Per Second
Write
31,712 62,479
Re a d
26,556 69,104
A6829A Ultra160 A7173A Ultra320
Chart 1a shows the number of I/O operations per second for 1KB reads and writes, using one A7173A
dual-channel Ultra320 SCSI adapter, and one A6829A dual-channel Ultra160 SCSI adapter. The
horizontal-axis represents the adapter type, and the vertical-axis represents the number of I/O
operations per second.
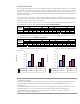
Additionally, Chart 1b shows the CPU Utilization Percentages for the four I/Ops tests shown in Chart 1a.
The horizontal-axis represents the adapter type, and the vertical-axis represents the total CPU
Utilization. In this case, all CPU Utilization data was gathered using HP’s GlancePlus system monitoring
software.
NOTE:
CPU Utilization could not be gathered using the standard Diskbench I/O performance measurement
tool due to the dual-core processor installed in the HP rp4440 PA-RISC Server. Diskbench can only be
used to produce accurate CPU Utilization results on a single CPU system.
0
20
40
60
80
100
CPU Utilization (%)
Write
80.3 83.9
Read
78.2 88.7
A6829A Ultra160 A7173A Ultra320