
HP A7173A PCI-X Dual Channel Ultra320 SCSI Host Bus Adapter Performance White Paper for HP PA-RISC Servers

4
0.00
0.20
0.40
0.60
0.80
1.00
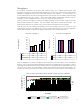
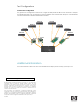
Ser vi ce Demand
A7173A Ultra320
0.36 0.27
A6829A Ultra160
0.88 0.55
4KB Read 8KB Read
0.00
0.20
0.40
0.60
0.80
1.00
Servi ce Demand
A7173A Ultra320
0.45 0.33
A6829A Ultra160
0.79 0.49
4KB Write 8KB Write
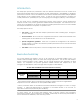
Service Demand
The A7173A U320 adapter creates a low service demand for smaller sized I/O operations. As a result,
the A7173A can perform more I/Ops without putting additional strain on the CPU and system
resources. To illustrate the vastly improved service demand of the A7173A U320 adapter over the
A6829A U160 adapter, service demand tests with both adapters were performed on an HP rp4440 with
a single dual-core CPU.
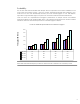
Service demand is important to large storage systems, because it indicates how many I/O’s per
second the system can achieve versus the CPU utilization. Therefore, lower Service Demand numbers
indicate better overall I/O system performance.
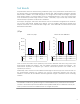
The following table shows single and dual port throughput, with matching CPU utilization and Service
Demand results for I/O sizes of 4KB and 8KB using the A7173A U320 adapter:
Sequential Read Sequential Write – IR ON
4
4KB 8KB 4KB 8KB
Number
of Ports
Tput
1
CPU
2
SD
3
Tput
1
CPU
2
SD
3
Tput
1
CPU
2
SD
3
Tput
1
CPU
2
SD
3
Single 144 69%
.466
153 72%
.461
91 66%
.706
137 69%
.495
Dual 195 72%
.362
287 78%
.267
172 80%
.453
246 84%
.332
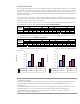
The following table shows single and dual port throughput, with matching CPU utilization results for I/O
sizes of 4KB and 8KB using the A6829A U160 adapter:
Sequential Read Sequential Write – IR ON
4
4KB 8KB 4KB 8KB
Number
of Ports
Tput
1
CPU
2
SD
3
Tput
1
CPU
2
SD
3
Tput
1
CPU
2
SD
3
Tput
1
CPU
2
SD
3
Single 143 61%
1.454
62 60%
.946
48 64%
1.311
72 60%
.825
Dual 81 73%
.876
122 69%
.549
93 75%
.789
136 69%
.493
Chart 2a: Dual Port Read Service Demand Chart 2b: Dual Port Write Service
Demand
NOTE:
1
Throughput in MB/sec
2
Dual-core CPU utilization numbers gathered using HP’s GlancePlus performance measurement tool.
3
Service Demand is calculated using the following equation: (% CPU Utilization/Throughput in
KB/sec)*1,000
4
To achieve maximum throughput over the SCSI bus, Immediate-Reporting (IR) was enabled for the
Sequential Write tests. I-R, more commonly known as disk caching, allows hard disk drives to
temporarily cache I/O requests before the data is written to the disk. As a result, overall SCSI
performance is dramatically improved.