
HP A7173A PCI-X Dual Channel Ultra320 SCSI Host Bus Adapter Performance White Paper for HP PA-RISC Servers

5
0
100
200
300
400
500
600
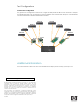
1 2 3 4 5 6 7 8 9 10 11 12 13 14 15 16 17 18 19 20 21 22 23 24 25 26
# of Disks
Throughput (M B/ sec)
0
10
20
30
40
50
60
70
% C PU
U320 Throughput U160 Throughput U320 CPU Utilization U160 CPU Utilization
0
100
200
300
400
500
600
700
Throughput (MB/ sec)
Write
249 365
Read
263 521
Theoretical Max
305 610
A6829A Ultra160 A7173A Ultra320
0
10
20
30
40
50
60
70
CPU Utilization (%)
Write
55.0 56.8
Read
54.0 58.8
A6829A Ultra160 A7173A Ultra320
Throughput
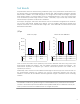
As previously mentioned, the A7173A U320 adapter boasts 521.1 MB/sec dual-channel read
throughput to power the most demanding applications. However, the most impressive performance
difference is highlighted within the A7173A U320 adapter’s CPU Utilization. As shown below, the
A7173A U320 adapter can increase throughput by fifty-one percent over the A6829A, while increasing
CPU Utilization less than five percent. The A7173A U320 adapter dramatically increases SCSI bus
throughput, without adding undue strain on the CPU and other system resources.
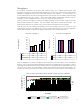
Chart 3a shows the throughput in MB/sec for 256KB sequential reads and writes, using one A7173A
dual-channel Ultra320 SCSI adapter, and one A6829A dual-channel Ultra160 SCSI adapter. The
horizontal-axis represents the adapter type, and the vertical-axis represents the throughput.
Chart 3b shows the CPU Utilization Percentages for the four throughput tests shown in Chart 3a. The
horizontal-axis represents the adapter type, and the vertical-axis represents the total CPU Utilization.
All CPU Utilization data was gathered using HP’s GlancePlus system monitoring software.
Chart 3a: Throughput Chart 3b: CPU Utilization
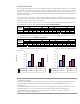
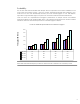
Chart 3c highlights the powerful throughput performance of one A7173A adapter versus one A6829A
adapter. The A7173A dual-channel Ultra320 SCSI adapter can significantly boost throughput, without
impacting other critical system resources allocated for your demanding HP-UX applications. For each
test shown in this chart, an equal number of disks were balanced across both SCSI channels. For
example, ten disks total is tested as five disks on SCSI channel one, and five disks on SCSI channel two.
Chart 3c: Read Throughput versus Number of Disks and CPU Utilization