Technical white paper HP Smart Array Controllers and basic RAID performance factors Technology brief Table of contents Abstract 2 Benefits of drive arrays 2 Factors that affect performance 2 HP Smart Array Controller performance Smart Array processor Smart Array cache 2 2 3 Drives and performance 6 RAID performance Read performance RAID Write performance 8 8 11 Smart Array processor and RAID performance Random write performance Sequential write performance 14 14 15 Additional RAID performanc
Abstract RAID storage technology continues to make advancements in drives, storage interfaces, RAID controller technology, and processing power. The features of the HP Smart Array Controller, the RAID level that you use, and drive technologies can all affect overall RAID performance. This technology brief provides an overview of the basic factors affecting RAID performance today.
processor writes the parity data to the drive array, the performance of the XOR operations is a key contributor to overall write performance of parity-based arrays. Performance improvements are most apparent in arrays with larger drive counts. The aggregate I/O of smaller drive counts, not the bandwidth of the Smart Array processor, constrains drive array performance.
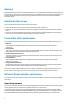
workloads. It uses read cache in a predictive capacity to pre-fetch data when it detects sequential workloads. It identifies the pattern of the read commands, and then reads ahead on the drives. After reading the data, the Smart Array controller puts that data into the cache, so it is available if the upcoming read commands call for it. Write Cache Through a process known as “posted writes” or “write-back caching,” Smart Array controllers use the write cache as an output buffer.
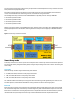
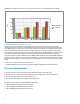
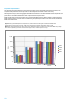
Figure 2. RAID 5 Random write performance: Comparing 4 KiB random write performance with 512 MiB versus 2 GiB FBWC. 3,500 I/O Per Second (IOPS) 3,000 2,500 RAID 5; 512MiB FBWC 2,000 RAID 5; 2GiB FBWC 1,500 1,000 500 0 4 Drives 8 Drives 12 Drives 16 Drives Figure 3. RAID 5 Online Transaction Processing (OLTP) performance (4 KiB aligned, 1/3 random write, 2/3 random read): Comparing 4 KiB OLTP write performance with 512 MiB FBWC versus 2 GiB FBWC.
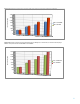
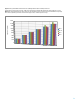
Figure 4. RAID 5 Sequential write performance: Comparing sequential write performance with 512 MiB FBWC versus 2 GiB FBWC. 2,500 MiB/s 2,000 RAID 5; 512MiB FBWC 1,500 RAID 5; 2GiB FBWC 1,000 500 0 4 Drives 8 Drives 12 Drives 16 Drives Optional battery backed or flash backed write cache In the event of a server or power failure, the data that is in the write cache at the time of the failure could be lost, resulting in possible data corruption.
The IOPS that a drive can sustain influences the random read and write performance of drive arrays. When using spinning media drives, the SAS-2 physical link’s bandwidth does not affect performance in application environments that rely heavily on random read and write operations. Consider the following points: • Currently, the fastest spinning media drives can deliver about 470 random IOPS using 4 KiB reads and writes. This translates to a throughput of 1.
RAID performance Most RAID levels improve read performance by distributing, or “striping,” data across a set of physical drives that have been configured as a single logical drive. Striping places a pre-determined amount of data onto a different physical drive in the array on a rotating basis. A “strip” is the amount of data written to each drive. A “stripe” is one complete row of data strips across all of the drives in an array.
Figure 5. Scaling of 4 KiB Random Read Performance (4 KiB aligned) 8x 6 GiB; drive limited performance Configuration: Smart Array P421 controller, 2 GiB cache; 15K SAS drives; maximum IOPS measured for queue depth from 1 to 256 Note: RAID 5 measurements with more than 14 drives are for illustrative purposes only. HP does not recommend RAID 5 arrays larger than 14 drives (depending on tolerance for data loss and type of drive, 14 drives may be too many).
Sequential read performance The maximum throughput capability of a drive determines upper limit on sequential performance (see Table 1). The sequential read performance of an array tends to scale directly with the number of drives in the array. With larger drive arrays, either the aggregate bandwidth of the SAS links or the PCIe bandwidth limit the sequential read performance. The smaller bandwidth for either component limits the performance. RAID 1+0 performance scales more slowly.
Figure 7. Scaling of 256 KiB Sequential Read Performance, drive limited until reaching the 8 x 6 GiB SAS bandwidth limit Configuration: Smart Array P421 controller, 2 GiB cache; 15K SAS drives; maximum measured for queue 1 to 256 Note: RAID 5 measurements with more than 14 drives are for illustrative purposes only. HP does not recommend RAID 5 arrays larger than 14 drives (depending on tolerance for data loss and type of drive, 14 drives may be too many).
Figure 8. RAID 1 and RAID 1+0 drive arrays Write operations for RAID 5 RAID 5 provides data protection by creating a “parity strip.” If any single drive fails, the data from the other drives can be used to mathematically reconstruct the missing data. Using the data values of the data stripe, the Smart Array uses an XOR calculation to determine parity.
With RAID 5, each high-level write operation to the logical drive takes several lower level operations. As Table 3 shows, each RAID 5 write takes four low level drive operations and a parity calculation. In the worst case, RAID 5 random write performance could be only one-quarter that of a single RAID 0 drive. Table 3.
Smart Array processor and RAID performance When using any of the parity-based RAID levels, both the write caching and the XOR algorithms for those processes are essential to delivering acceptable write performance for drive arrays. The significant write performance penalty that occurs without write caching is one of the reasons that the Zero Memory versions of the Smart Array controllers only support RAID 0 and RAID 1.
Figure 11. Scaling of 4 KiB random write performance (4KiB aligned) 8 x 6 GiB; drive limited performance Configuration: Smart Array P421 controller, 2 GiB cache; 15K SAS drives; maximum measurement for queue depth from 1 to 256 Note: RAID 5 measurements with more than 14 drives are for illustrative purposes only. HP does not recommend RAID 5 arrays larger than 14 drives (depending on tolerance for data loss and type of drive, 14 drives may be too many).
Figure 12. Scaling of 256 KiB sequential write performance, drive limited until reaching the 4 x 6 GiB SAS bandwidth limit Configuration: Smart Array P421 controller, 2 GiB cache; 15K SAS drives; queue fixed at 64 or maximum IOPS measured for queue depth from 1 to 256. Note: RAID 5 measurements with more than 14 drives are for illustrative purposes only. HP does not recommend RAID 5 arrays larger than 14 drives (depending on tolerance for data loss and type of drive, 14 drives may be too many).
Figure 13. Scaling of 256 KiB sequential write performance; RAID 0/10, drive limited until reaching the 8 x 6 GiB SAS bandwidth limit; RAID 5/6, drive limited until reaching the controller RAID 5/6 sequential write limit Configuration: Smart Array P421 controller, 2 GiB cache; 15K SAS drives; queue depth 64; maximum IOPS measured for queue depth from 1 to 256 Note: RAID 5 measurements with more than 14 drives are for illustrative purposes only.
For more information Visit the URLs listed below if you need additional information. Resource description Web address HP Smart Array Controller technology – Technology Brief http://h20000.www2.hp.com/bc/docs/support/SupportManual/c00687518/ c00687518.pdf Performance factors for HP ProLiant Serial Attached Storage (SAS) – Technology Brief http://h20000.www2.hp.com/bc/docs/support/SupportManual/c01460725/ c01460725.pdf RAID 6 with HP Advanced Data Guarding technology – Technology Brief http://h20000.