
HP Smart Array Controllers and basic RAID performance factors

15
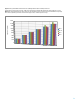
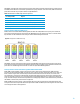
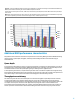
Figure 11. Scaling of 4 KiB random write performance (4KiB aligned) 8 x 6 GiB; drive limited performance
Configuration: Smart Array P421 controller, 2 GiB cache; 15K SAS drives; maximum measurement for queue depth from 1 to 256
Note: RAID 5 measurements with more than 14 drives are for illustrative purposes only. HP does not recommend RAID 5 arrays larger
than 14 drives (depending on tolerance for data loss and type of drive, 14 drives may be too many).
It is important to note that while the relative random write performance is impacted significantly by RAID levels than
random read performance; the write cache does help increase random write performance overall. This is best
exemplified by RAID 0, which has no write penalty. A twelve drive RAID 0 logical drive performs 8,350 random writes per
second while achieving only 4,850 random reads per second. This difference is primarily attributable to the benefits of
the write cache.
Sequential write performance
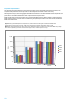
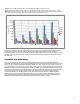
Figure 12 compares the write performance of the different RAID levels when executing 64 KiB sequential writes.
Compared to random writes, there are two noticeable differences in the performance curves. With sequential writes, the
difference in performance between RAID 0 and RAID 5 or RAID 6 is not nearly as great as it was for random writes. This
can be attributed to the write cache, and more particularly to write coalescing. Sequential writes allow the Smart Array
controller to coalesce them into full stripe writes. For RAID 5 and RAID 6, this eliminates the additional read operations
normally required and therefore increases their performance relative to RAID 0. Secondly, sequential write performance
does not tend to scale as the number of physical drives in the logical array increases past a certain point. When
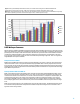
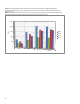
connection bandwidth is not the limiting factor (such as, x8 connection as shown in Figure 13) RAID 5 and RAID 6,
sequential write performance plateaus when the controller processor reaches the limits of its ability to perform the
required XOR computations. When the aggregated drive throughput approaches the connection bandwidth RAID 0
performance plateaus when the maximum throughput that the drives can maintain is reached.
0
2,000
4,000
6,000
8,000
10,000
12,000
14,000
16,000
4 Drives
8 Drives
12 Drives
16 Drives
20 Drives
24 Drives
RAID 0
RAID 10
RAID 5
RAID 6
I/O per second (IOPS)