
HP Storage Essentials V5.1 User Guide First Edition (T4283-96026, August 2006)


Finding an Element’s Storage Capacity574
The page appears in the right pane.
8. When you are ready to print, click Print.
9. Click Close.
NOTE: To revert back to all of the original settings, click the Default button next to the Print
button.
Viewing Capacity Charts
Capacity Manager provides a graphical representation of the capacity history of an element, such
as port summary information for switches.
You can manipulate the charts, so they show a different reporting period and frequency. For
example, you could show the capacity of a host over the past 24 hours with an hourly monitoring
frequency.
Keep in mind the following:
• Verify the performance collector for the element is enabled (Optimize > Storage Essentials >
Performance Data Collection). See ”Managing Performance Collection” on page 217 for
more information about enabling performance collectors.
• Switches and storage systems display data from the last time Discovery Data Collection/Get
Details was performed. See ”Step 1 - Discover Switches” on page 32 for more information.
• If you see “There is not enough data to produce a chart [chart_title] at this time.” message,
lessen the frequency option, so that the amount of time listed in the Frequency drop-down
menu has passed before you view the chart again. For example, if the Frequency menu
displays hourly, you need to wait an hour for data to appear in the chart.
To find the performance of an element:
1. Access Capacity Manager as described in ”Accessing Capacity Manager” on page 563.
2. Click the element for which you want to see a history of its capacity.
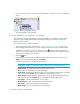
3. In the bottom split pane, click the Chart tab.
4. In the lower-middle split pane, click a report title.
The chart for the monitoring option is displayed in the lower-right pane.
NOTE: You can change the orientation of the chart by holding down the mouse button
when you click the chart and moving the mouse.
5. To change the reporting period, do one of the following. Then, click the button to update the
chart.
• Display data within a time period - You can format the graph to provide data within the
time period specified. Select the option to the left of the Period combo box. Select one of
the following from the drop-down combo box. Then, click the button to update the chart.